 English
  Русский
 Bahasa Indonesia
 Bahasa Malay
 ไทย
ไทย Español
 Deutsch
 Български
 Français
 Tiếng Việt
 中文
中文 বাংলা
বাংলা हिन्दी
 Čeština
 Українська
 Română
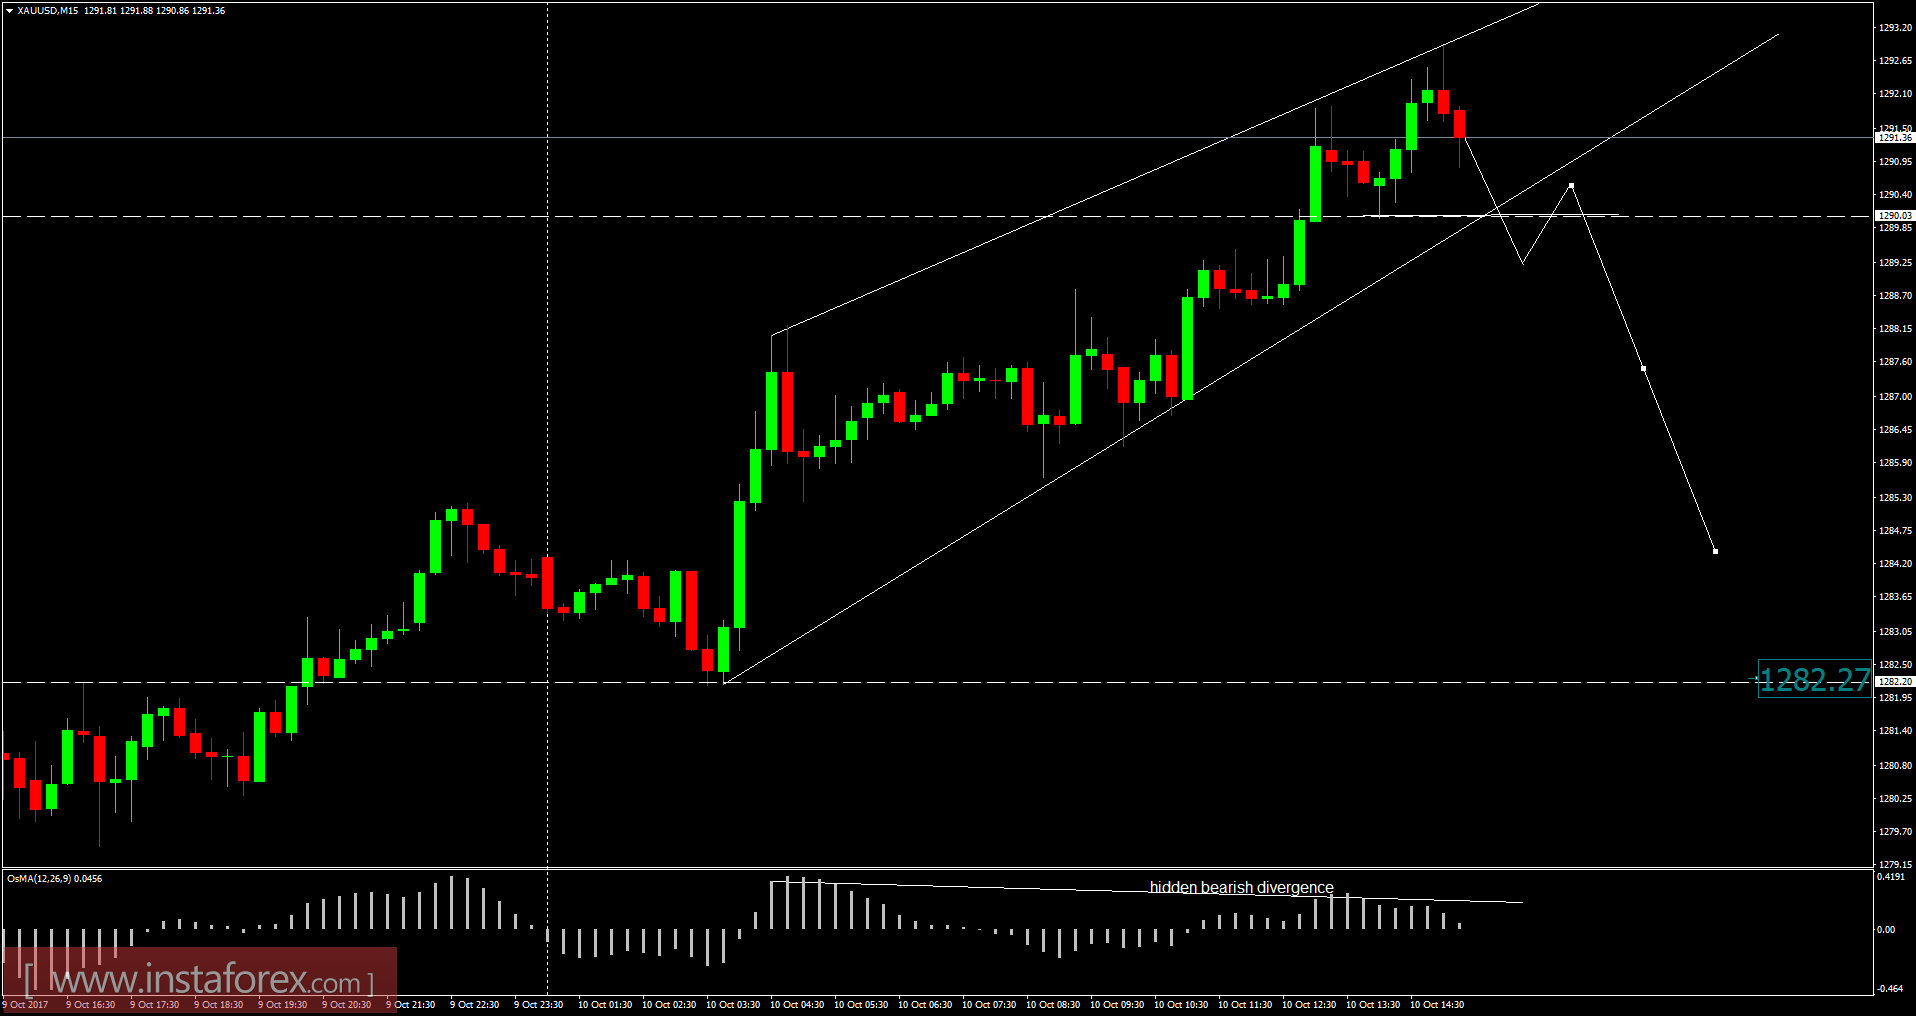
Resistance levels:
R1: $1,292.60
R2: $1,294.40
R3: $1,296.30
Support levels:
S1: $1,288.90
S2: $1,286.55
S3: $1,285.00
Trading recommendations for today: watch for potential selling opportunities.
 Long-term review
Resistance levels:
R1: $1,292.60
R2: $1,294.40
R3: $1,296.30
Support levels:
S1: $1,288.90
S2: $1,286.55
S3: $1,285.00
Trading recommendations for today: watch for potential selling opportunities.