 English
  Русский
 Bahasa Indonesia
 Bahasa Malay
 ไทย
ไทย Español
 Deutsch
 Български
 Français
 Tiếng Việt
 中文
中文 বাংলা
বাংলা हिन्दी
 Čeština
 Українська
 Română

The pair is finding resistance around the 1.3195 level and it's trying to do a pullback, as the 200 SMA coincides with that area, giving dynamic resistance across the board. If that happens, we might expect a decline to test the support level of 1.3037. With a breakout higher, GBP/USD could be looking for the 1.3309 level.
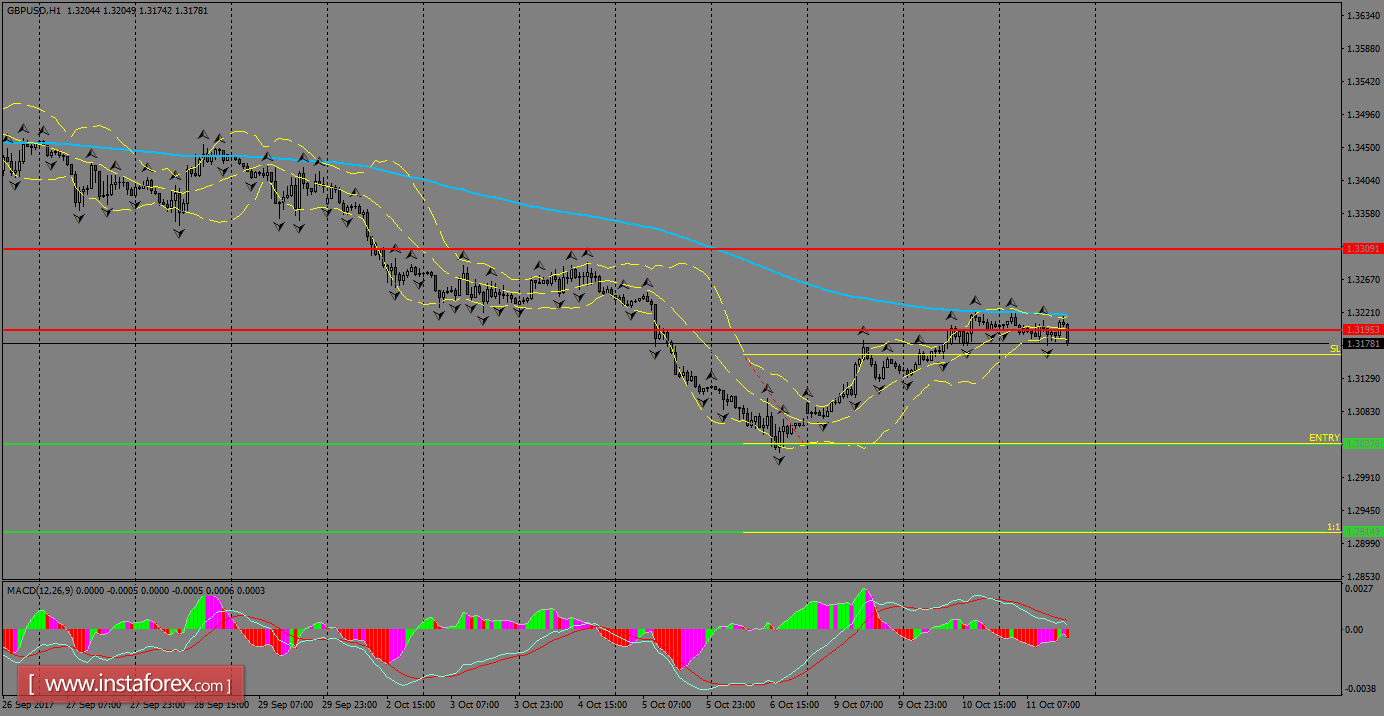
H1 chart's resistance levels: 1.3195 / 1.3309
H1 chart's support levels: 1.3037 / 1.2914
Trading recommendations for today: Based on the H1 chart, sell (short) orders only if the GBP/USD pair breaks a bearish candlestick; the support level is at 1.3037, take profit is at 1.2914 and stop loss is at 1.3161.