 English
  Русский
 Bahasa Indonesia
 Bahasa Malay
 ไทย
ไทย Español
 Deutsch
 Български
 Français
 Tiếng Việt
 中文
中文 বাংলা
বাংলা हिन्दी
 Čeština
 Українська
 Română

The index is consolidating below the 200 SMA at H1 chart and it's being supported by the 93.00 level, at which a breakout should expose the next target lying around 91.67. The overall structure is sideways and that's why we should be cautious when placing new orders at this stage. MACD indicator remains in the negative territory, favoring to the bears.
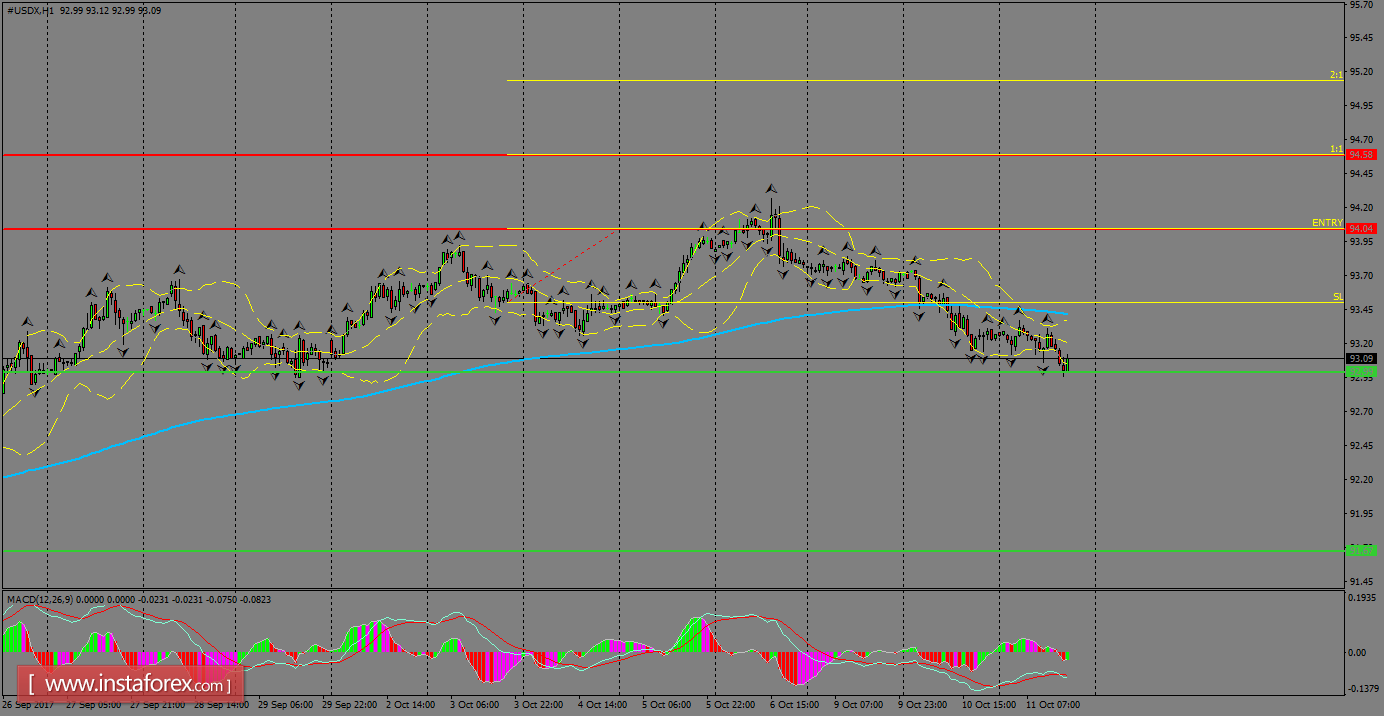
H1 chart's resistance levels: 94.04 / 94.58
H1 chart's support levels: 93.00 / 91.67
Trading recommendations for today: Based on the H1 chart, place buy (long) orders only if the USD Index breaks with a bullish candlestick; the resistance level is at 94.04, take profit is at 94.58 and stop loss is at 93.50.