 English
  Русский
 Bahasa Indonesia
 Bahasa Malay
 ไทย
ไทย Español
 Deutsch
 Български
 Français
 Tiếng Việt
 中文
中文 বাংলা
বাংলা हिन्दी
 Čeština
 Українська
 Română

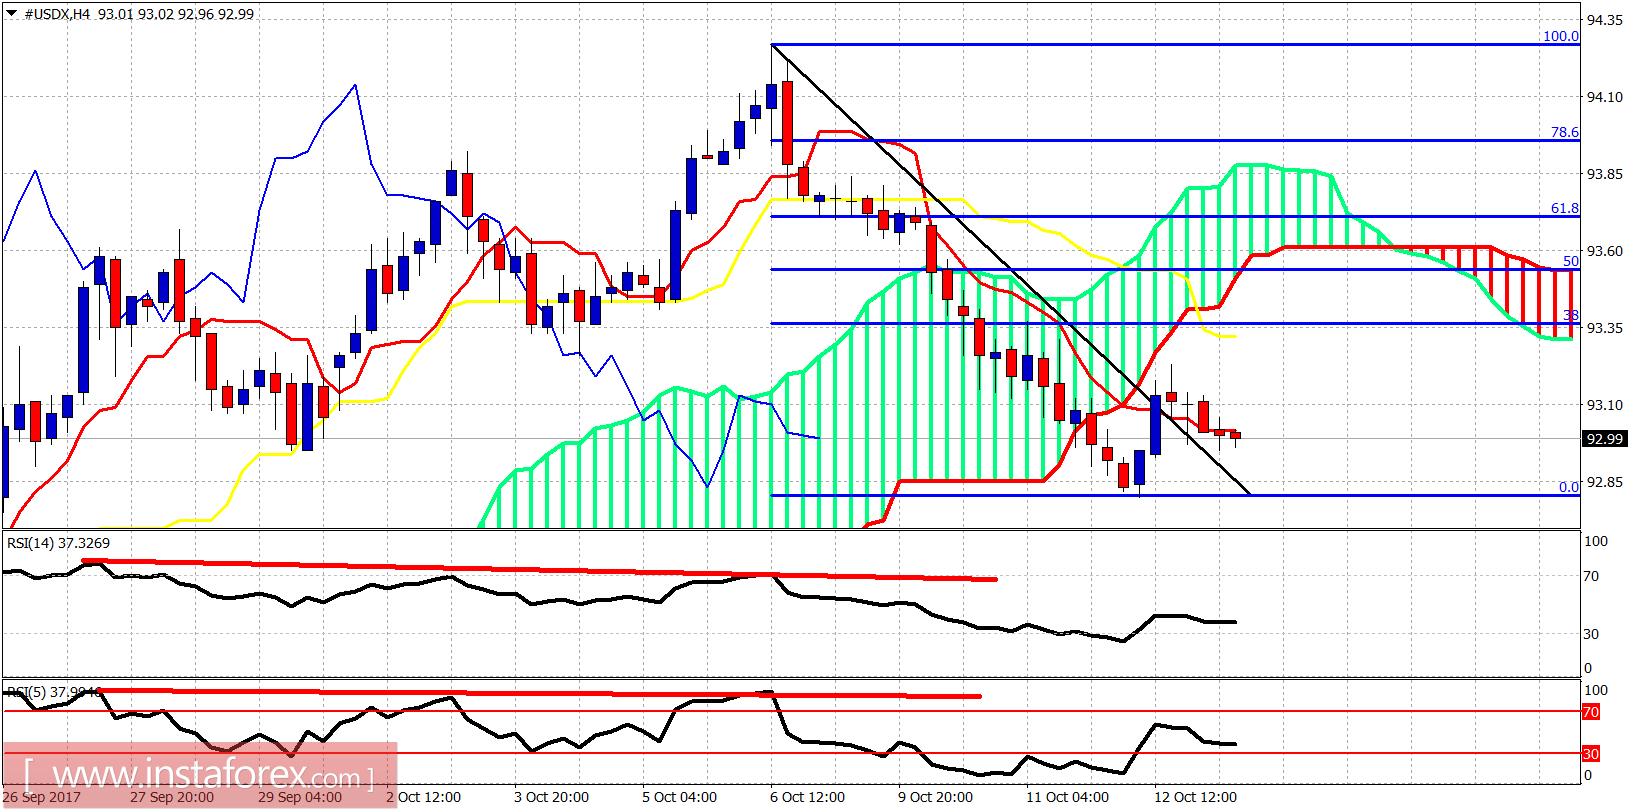
The Dollar index has broken below 93 and this is a bearish sign. Price is now trading below the Ichimoku cloud. We could see a bounce to back test the lower boundary of the clouds, but I would expect price to get rejected.
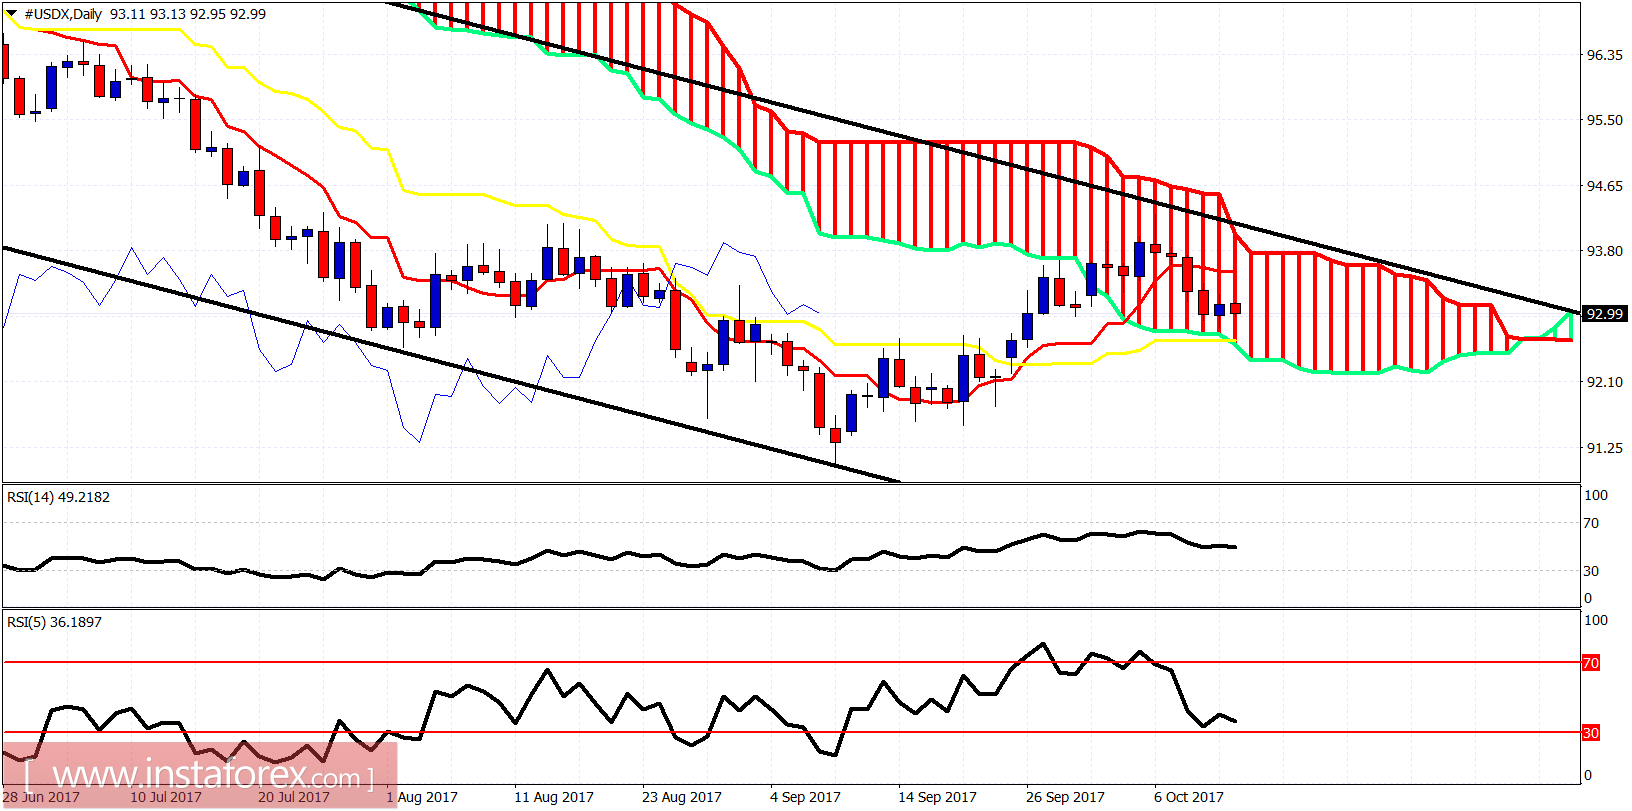
The Dollar index remains inside the bearish channel and price has now broken below the tenkan-sen (Red line indicator). Next important support is at 92.60 where the lower cloud boundary is found together with the kijun-sen (yellow line indicator). Breaking below that level will confirm that we have started the next downward move to new lows.