Gold price is making new higher highs today in early trading. Price has broken through the 38% Fibonacci retracement very easily as it should, since we are in a bullish trend towards new highs. Longer-term view on gold price remains bullish looking for a move above $1,400.
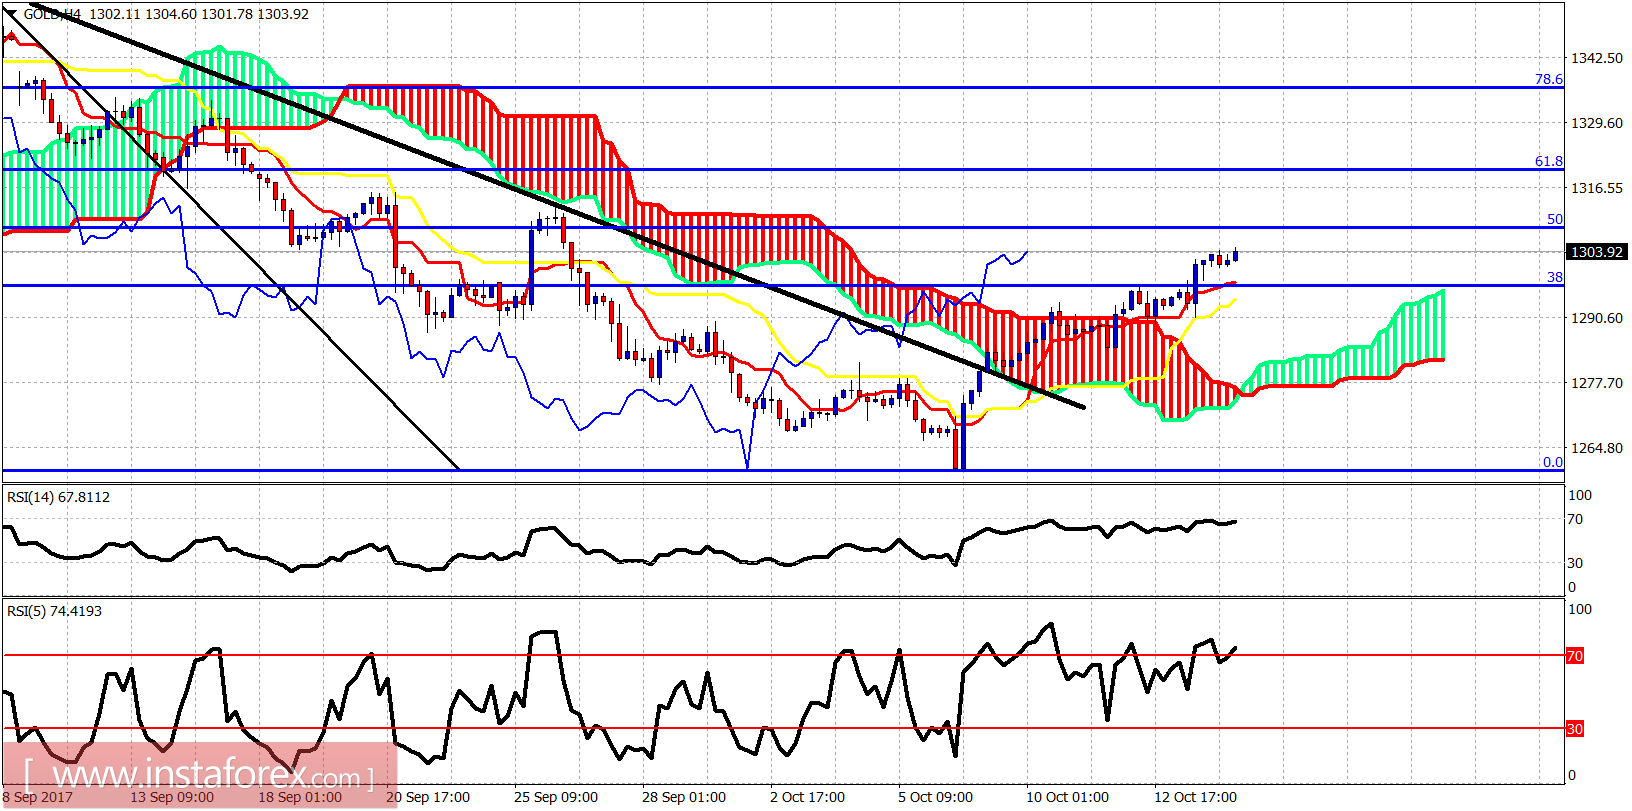
Gold price is trading above both the tenkan- and kijun-sen indicators (red and yellow trend lines). Gold price is making higher highs and higher lows. Support is at $1,298. Resistance is now at $1,308.50 and next at $1,320. Breaking above $1,320 will confirm our $1,400 view. Bulls need to break that level.
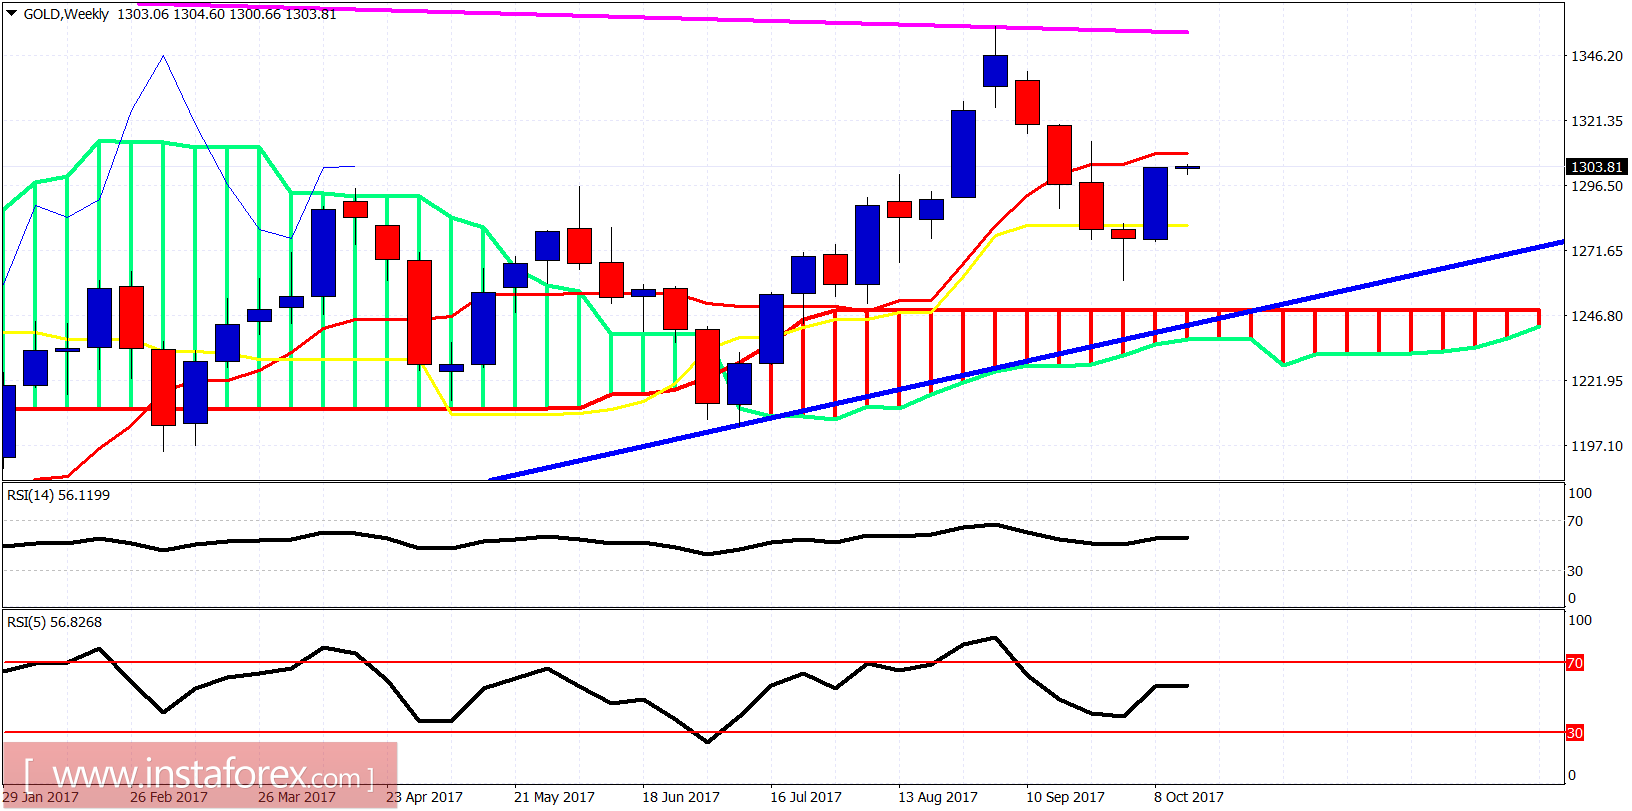
The reversal bullish hammer pattern has played out very well as expected so far. The tenkan-sen is resistance (red line indicator). A weekly close above it will be a bullish sign. A rejection in the area of $1,320-$1,310 could bring a pullback in Gold prices towards $1,280.
*The market analysis posted here is meant to increase your awareness, but not to give instructions to make a trade
 English
  Русский
 Bahasa Indonesia
 Bahasa Malay
 ไทย
ไทย Español
 Deutsch
 Български
 Français
 Tiếng Việt
 中文
中文 বাংলা
বাংলা हिन्दी
 Čeština
 Українська
 Română
