 English
  Русский
 Bahasa Indonesia
 Bahasa Malay
 ไทย
ไทย Español
 Deutsch
 Български
 Français
 Tiếng Việt
 中文
中文 বাংলা
বাংলা हिन्दी
 Čeština
 Українська
 Română

USDX is dealing with the dynamic resistance offered by the H1 chart and it can help to make a pullback in the index and to resume the bearish bias across the board. With a bearish continuation, USDX might be looking for the next critical support lying at the 91.67 level. MACD indicator is temporarily supporting the bearish price action.
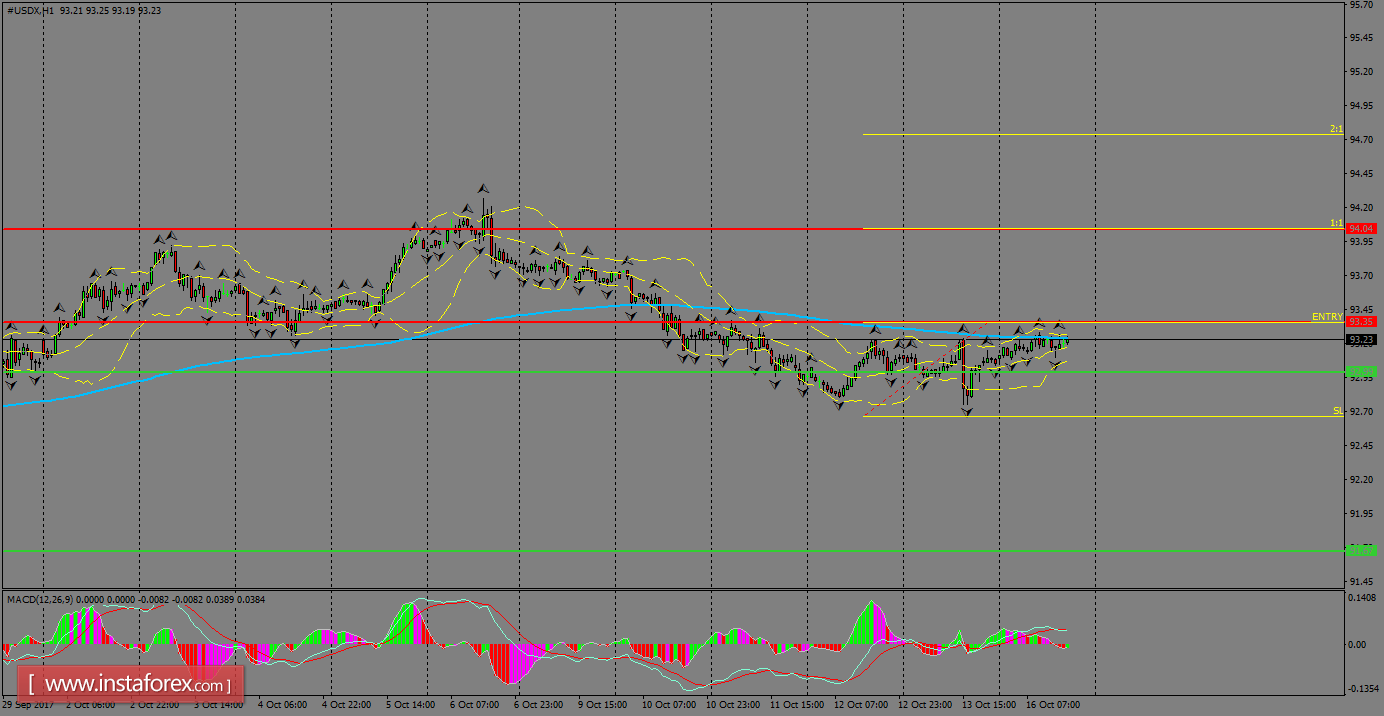
H1 chart's resistance levels: 93.35 / 94.58
H1 chart's support levels: 93.00 / 91.67
Trading recommendations for today: Based on the H1 chart, place buy (long) orders only if the USD Index breaks with a bullish candlestick; the resistance level is at 93.35, take profit is at 94.58 and stop loss is at 92.66.