 English
  Русский
 Bahasa Indonesia
 Bahasa Malay
 ไทย
ไทย Español
 Deutsch
 Български
 Français
 Tiếng Việt
 中文
中文 বাংলা
বাংলা हिन्दी
 Čeština
 Українська
 Română

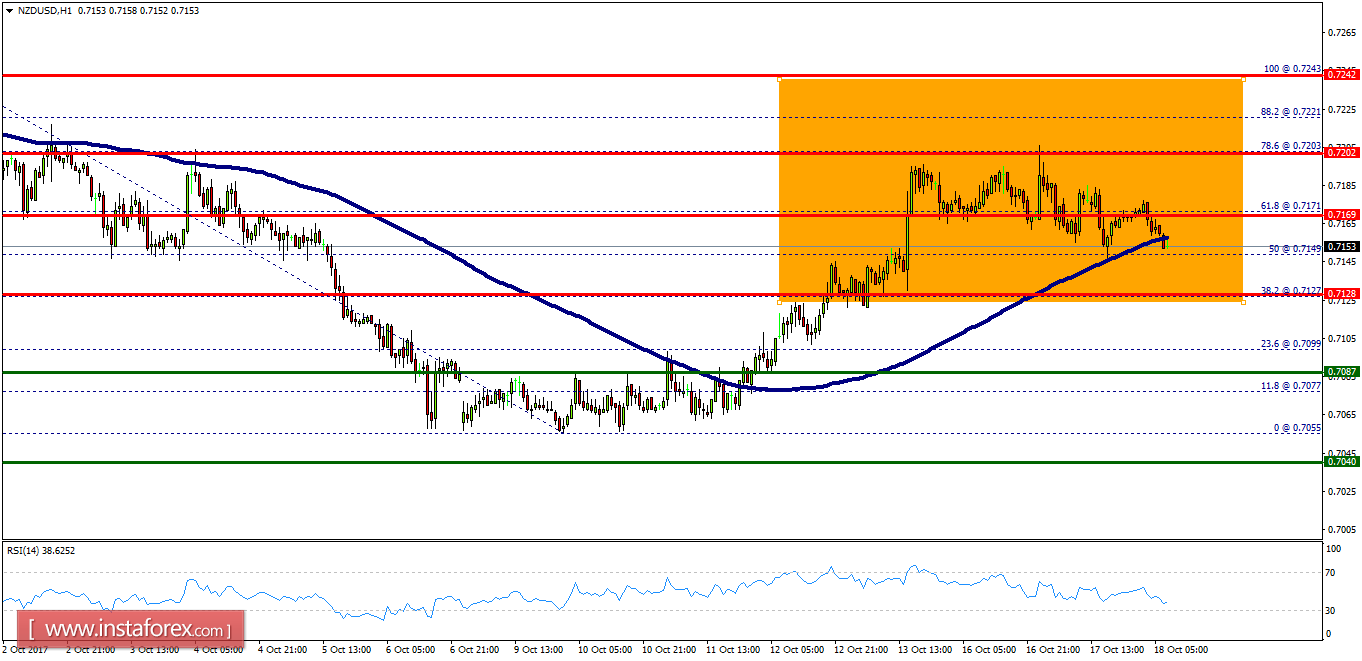
Overview:
- As expected, the trend is still trading around the zone of 0.7128-0.7150. It should be noted that the support is established at the level of 0.7128 which represents the 38.2% Fibonacci retracement level on the H1 chart. Also, it might notice that a weekly pivot point is seen at the price of 0.7128. Hence, The NZD/USD pair probably continues to rise from the level of 0.7128 in the long term. The price is likely to form a double bottom in the same time frame. Accordingly, the NZD/USD pair is showing signs of strength following a breakout of the highest level of 0.7128. So, rebuy above the level of 0.7128 with the first target at 0.7171 in order to test the daily resistance 1 and further to 0.7203. Also, it might be noted that the level of 0.7242 is a good place to take profit because it will form a double top at the same timeframe.