 English
  Русский
 Bahasa Indonesia
 Bahasa Malay
 ไทย
ไทย Español
 Deutsch
 Български
 Français
 Tiếng Việt
 中文
中文 বাংলা
বাংলা हिन्दी
 Čeština
 Українська
 Română

USDX is looking to consolidate once again above the 200 SMA, as it remains trapped in a range between the 94.04 and 92.80 levels, according to our H1 chart projections. If the level of 94.58 gives up to the bulls' force, the next target for the index lies at the psychological zone of 95.00. To the downside, the nearest support is placed at 93.00.
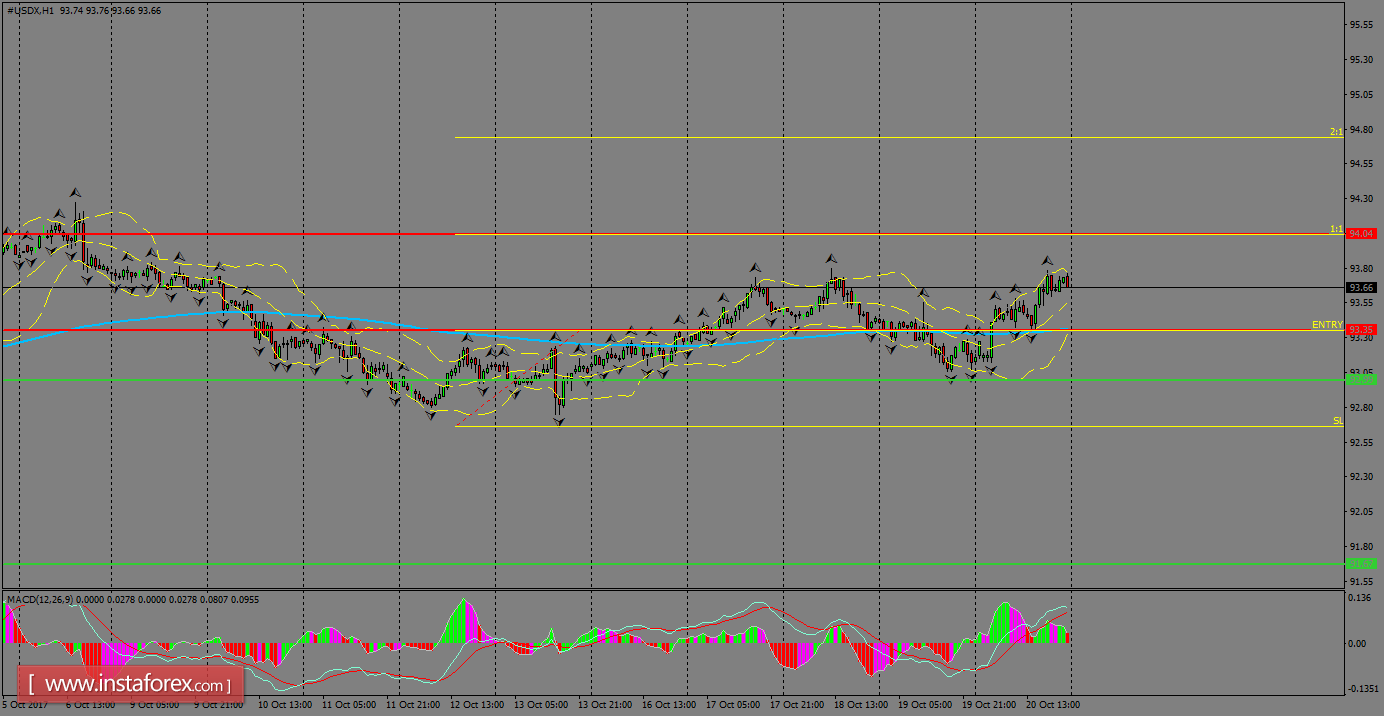
H1 chart's resistance levels: 93.35 / 94.58
H1 chart's support levels: 93.00 / 91.67
Trading recommendations for today: Based on the H1 chart, place buy (long) orders only if the USD Index breaks with a bullish candlestick; the resistance level is at 93.35, take profit is at 94.58 and stop loss is at 92.66.