 English
  Русский
 Bahasa Indonesia
 Bahasa Malay
 ไทย
ไทย Español
 Deutsch
 Български
 Français
 Tiếng Việt
 中文
中文 বাংলা
বাংলা हिन्दी
 Čeština
 Українська
 Română

Overview
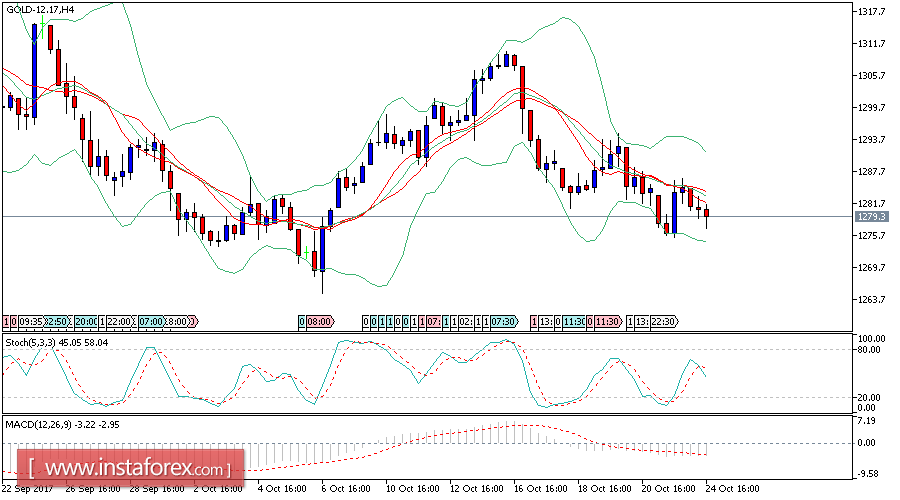
Gold price closed yesterday's trading above $1,281.17 level, noticing that the last decline is confined inside falling Wedge pattern which signs appear on chart. As the price attempts to breach its resistance and moves above its resistance now, which hints the price head to regain the main bullish trend again and stop the negative pressure that dominated the recent trades. Therefore, the bullish bias will be suggested in the upcoming sessions, and the targets begin by testing $1,299.20 level, noting that breaking $1,281.17 and trading below it again will reactivate the correctional bearish trend scenario that its next target located at $1,263.15. The expected trading range for today is between 1270.00 support and 1295.00 resistance.