 English
  Русский
 Bahasa Indonesia
 Bahasa Malay
 ไทย
ไทย Español
 Deutsch
 Български
 Français
 Tiếng Việt
 中文
中文 বাংলা
বাংলা हिन्दी
 Čeština
 Українська
 Română

Bears in the GBP/USD continue to dominate the bias for the short-term, as the 200 SMA at H1 chart managed to make a pullback and offered strong dynamic resistance across the board. The next target is placed at the October 20th lows and if it gives up, then we might expect another leg lower towards 1.3037. To the upside, the nearest resistance lies at 1.3216.
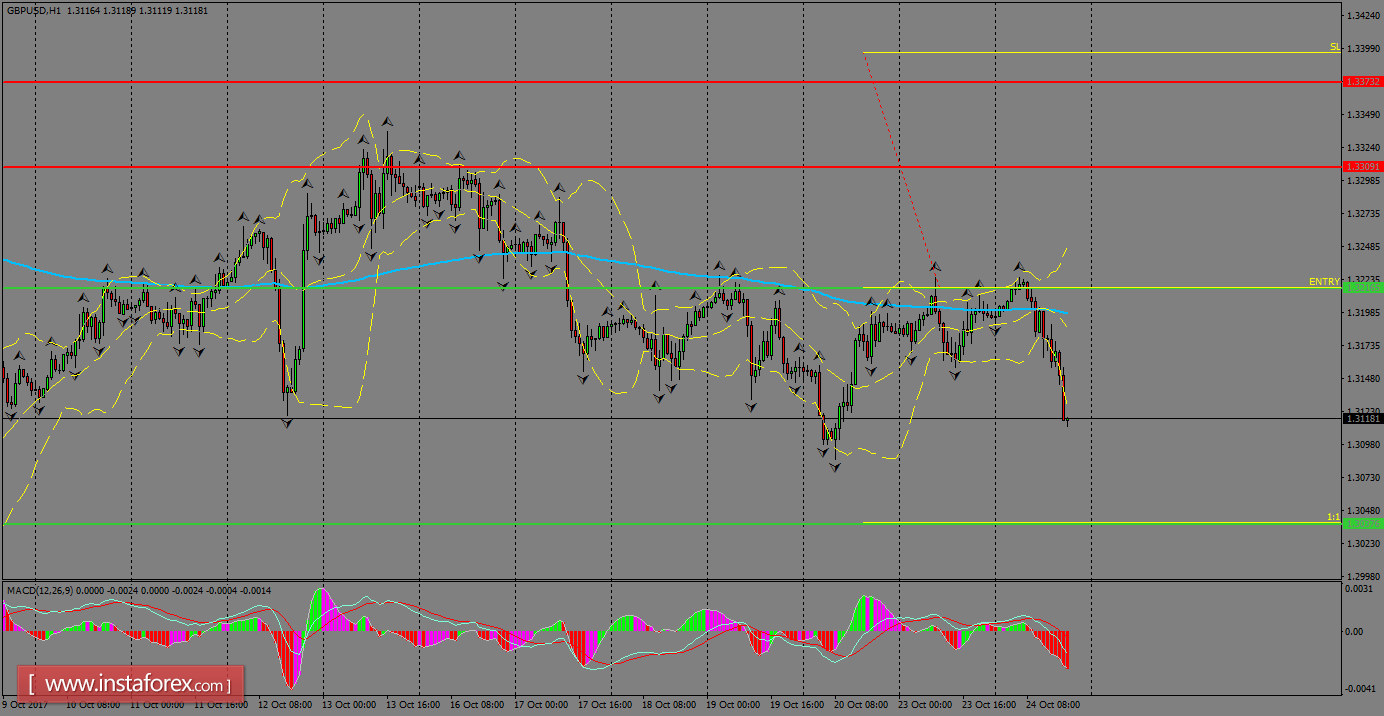
H1 chart's resistance levels: 1.3309 / 1.3373
H1 chart's support levels: 1.3216 / 1.3037
Trading recommendations for today: Based on the H1 chart, sell (short) orders only if the GBP/USD pair breaks a bearish candlestick; the support level is at 1.3216, take profit is at 1.3037 and stop loss is at 1.3398.