Gold price is trading around its important short-term resistance area of $1,283-87. There is no clear break out above the resistance area as price has stuck around here. There are some Fibonacci retracement resistance levels here that are important and should not be ignored.
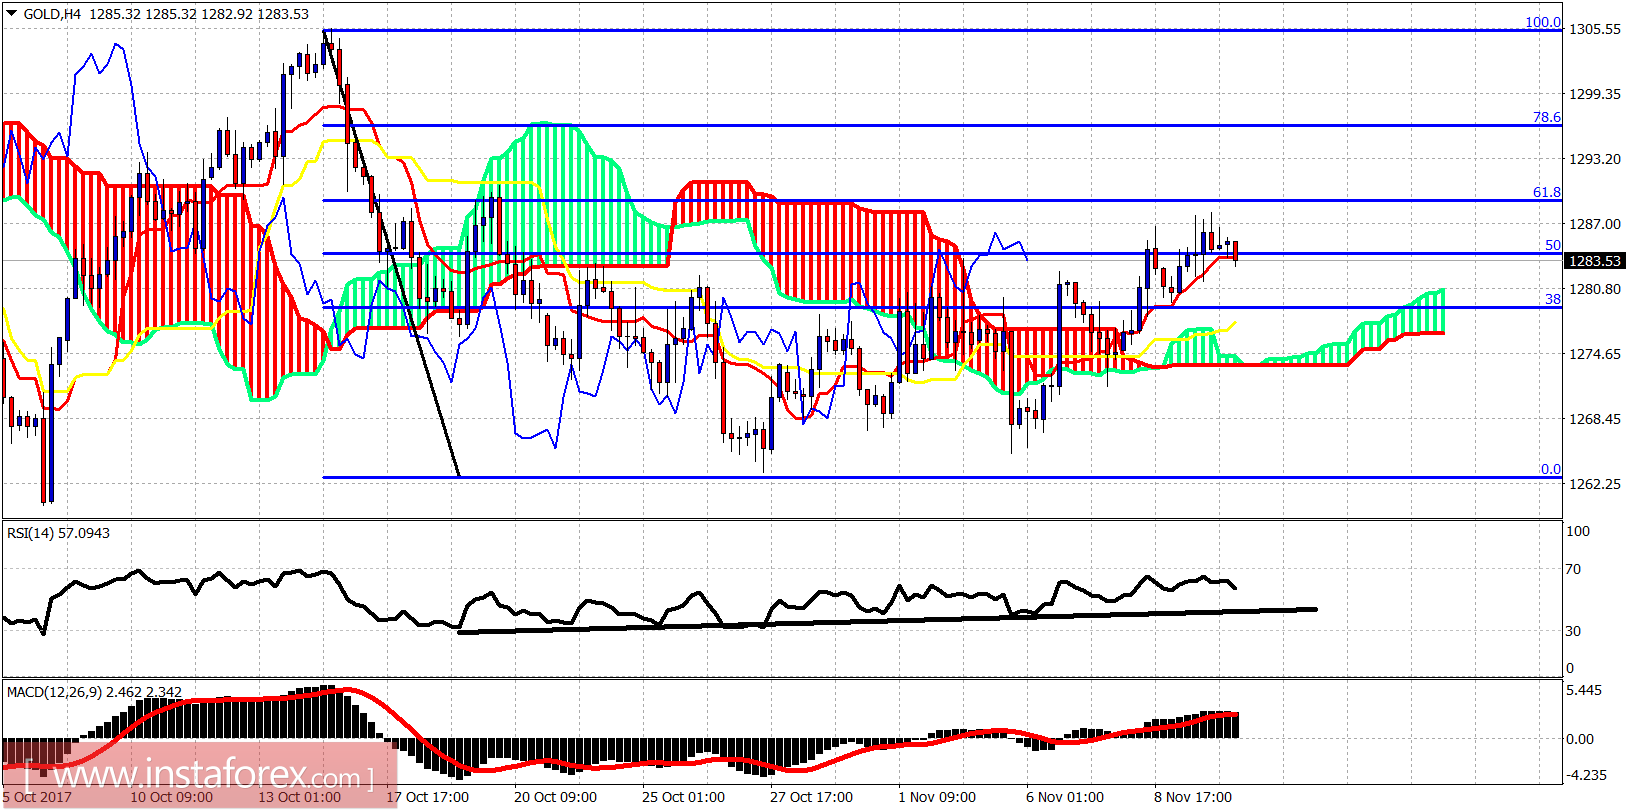
Gold price is trading above the 4-hour Ichimoku cloud. Cloud support is at $1,274. As long as price is above this level trend is bullish in the short-term. Price so far reached the 61.8% Fibonacci retracement and is getting rejected. A pull back is very likely. Resistance is at $1,288-89.
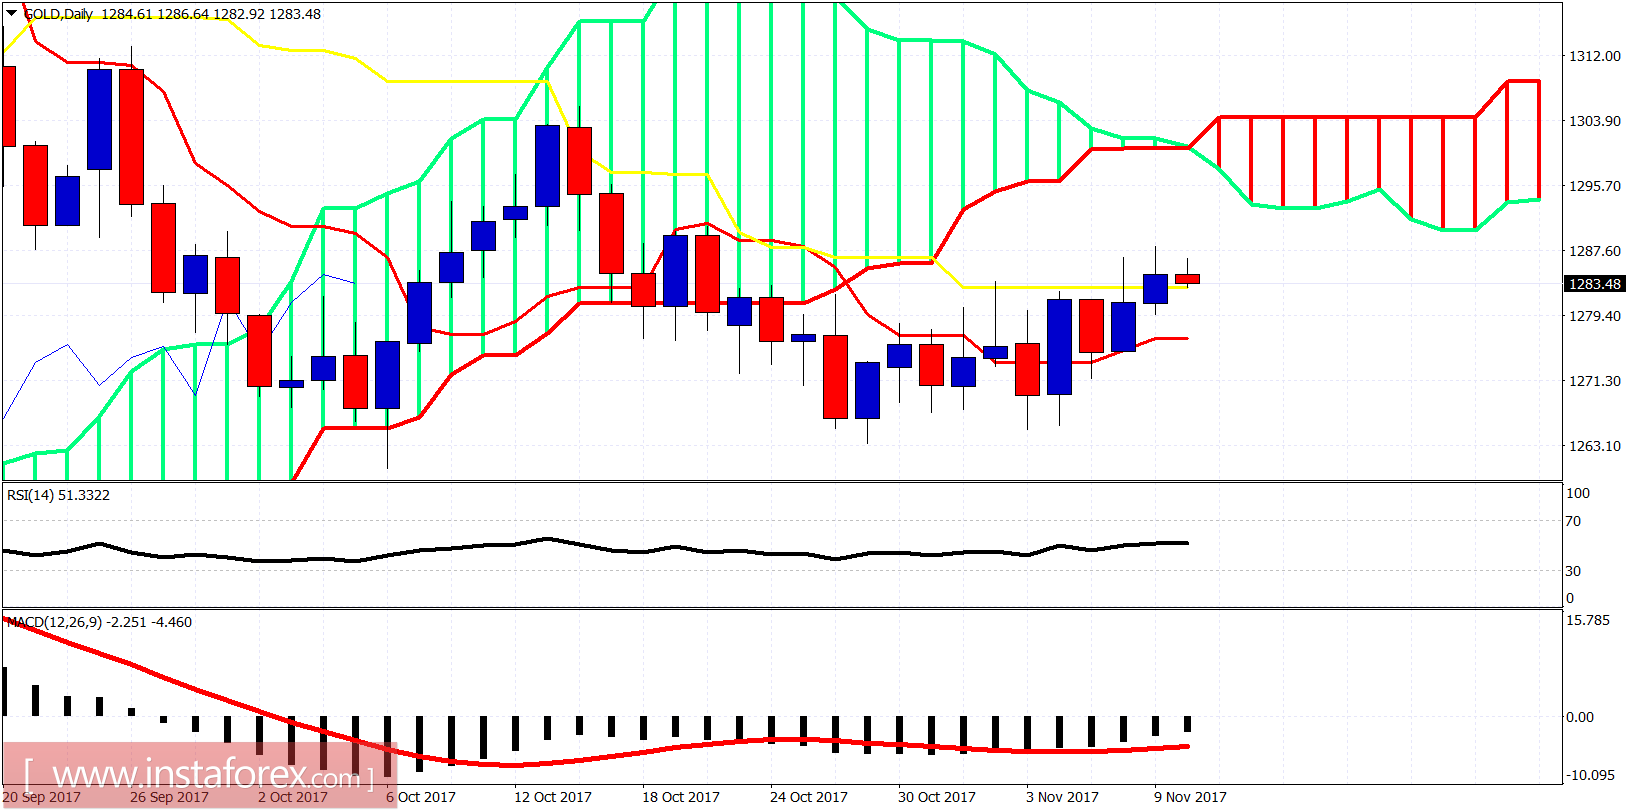
Yesterday's daily candle closed above the kijun-sen and this is a bullish sign. This increases the chances of moving towards the daily Kumo (cloud). Daily support is at $1,276. This is the tenkan-sen (red line indicator). Bulls do not want to see a daily close below it.
*The market analysis posted here is meant to increase your awareness, but not to give instructions to make a trade
 English
  Русский
 Bahasa Indonesia
 Bahasa Malay
 ไทย
ไทย Español
 Deutsch
 Български
 Français
 Tiếng Việt
 中文
中文 বাংলা
বাংলা हिन्दी
 Čeština
 Українська
 Română
