 English
  Русский
 Bahasa Indonesia
 Bahasa Malay
 ไทย
ไทย Español
 Deutsch
 Български
 Français
 Tiếng Việt
 中文
中文 বাংলা
বাংলা हिन्दी
 Čeština
 Українська
 Română

The Dollar index has entered the Ichimoku cloud. Trend has changed to neutral. However medium-term trend remains bullish as price is making higher highs and higher lows.
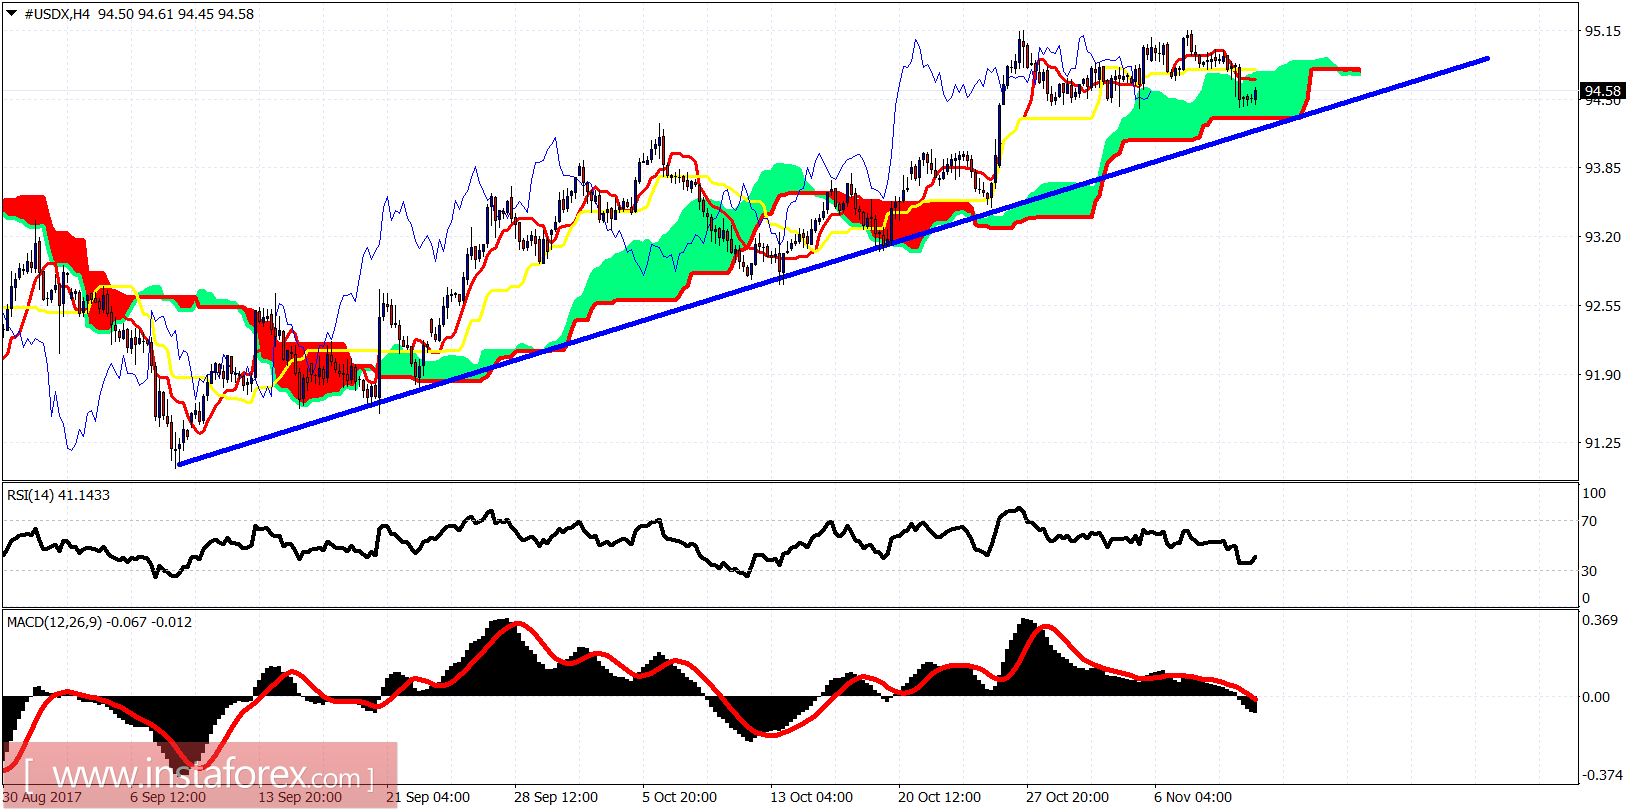
The Dollar index short-term trend is neutral as price has entered inside the Ichimoku cloud. Support is at the lower cloud boundary and at the blue trend line support at 94.28-94.20. Resistance is at 94.75.
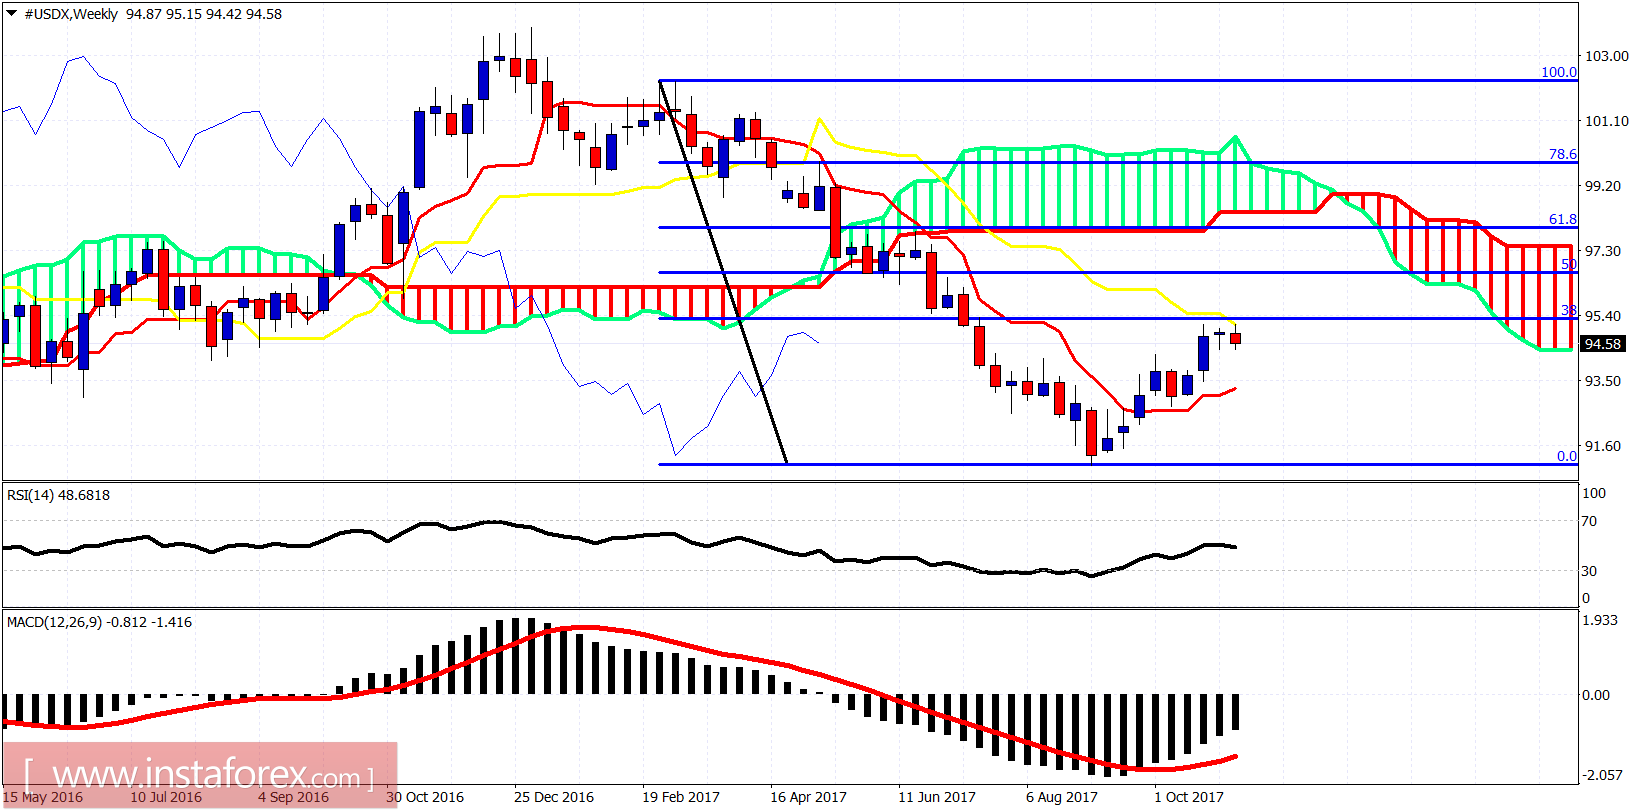
On a weekly basis, we see price turn around as it is being rejected by the weekly kijun-sen (yellow line indicator) and the 38% Fibonacci retracement. This is a bearish sign that will at least push price towards the tenkan-sen (red line indicator). I remain longer-term bearish but we do not have a confirmation yet that the entire upward corrective bounce is complete.