 English
  Русский
 Bahasa Indonesia
 Bahasa Malay
 ไทย
ไทย Español
 Deutsch
 Български
 Français
 Tiếng Việt
 中文
中文 বাংলা
বাংলা हिन्दी
 Čeština
 Українська
 Română

USDX is waiting for a catalyst that helps to drive the index towards new highs or to continue with the bearish bias across the board. To the downside, if it manages to break below last Friday's lows, then we can expect another decline to test the support level of 93.97, while to the upside, the critical 200 SMA should be broken in order to allow gains towards November 7th highs.
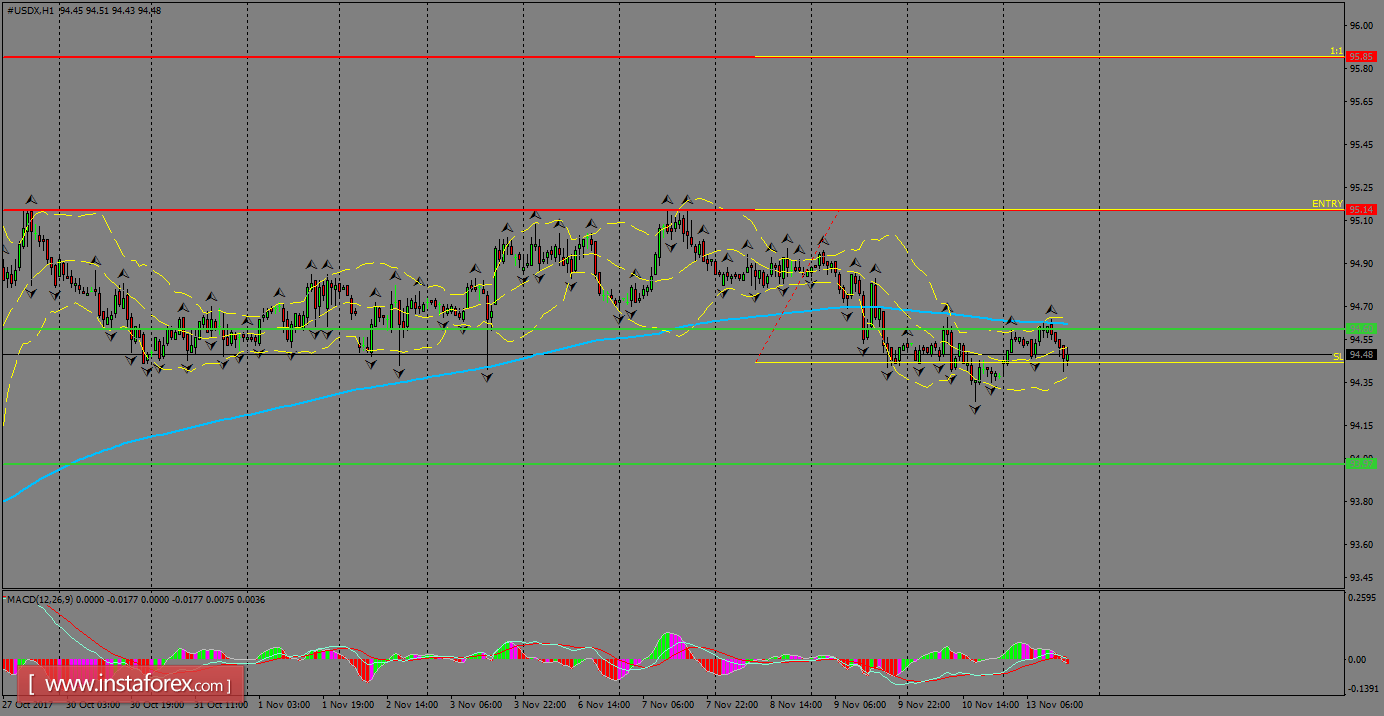
H1 chart's resistance levels: 95.14 / 95.85
H1 chart's support levels: 94.60 / 93.97
Trading recommendations for today: Based on the H1 chart, place buy (long) orders only if the USD Index breaks with a bullish candlestick; the resistance level is at 95.14, take profit is at 95.85 and stop loss is at 94.47.