 English
  Русский
 Bahasa Indonesia
 Bahasa Malay
 ไทย
ไทย Español
 Deutsch
 Български
 Français
 Tiếng Việt
 中文
中文 বাংলা
বাংলা हिन्दी
 Čeština
 Українська
 Română

The pair is struggling to consolidate above the 200 SMA at the H1 chart, which remains as the dynamic support for the short-term, but bulls are not enough strong to push higher the GBP/USD pair. However, if it manages to break, a boost could happen towards the resistance zone of 1.3309. MACD indicator remains in the positive territory.
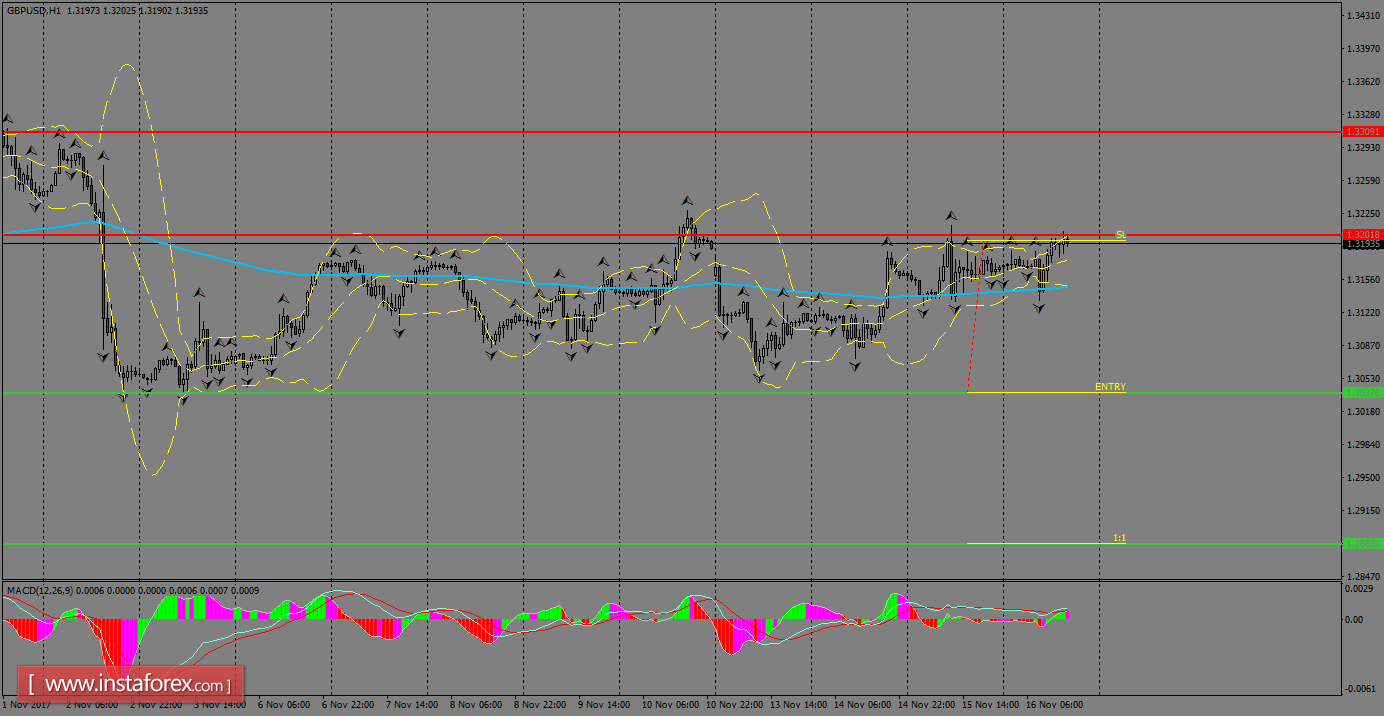
H1 chart's resistance levels: 1.3201 / 1.3309
H1 chart's support levels: 1.3037 / 1.2880
Trading recommendations for today: Based on the H1 chart, sell (short) orders only if the GBP/USD pair breaks a bearish candlestick; the support level is at 1.3037, take profit is at 1.2880 and stop loss is at 1.3193.