 English
  Русский
 Bahasa Indonesia
 Bahasa Malay
 ไทย
ไทย Español
 Deutsch
 Български
 Français
 Tiếng Việt
 中文
中文 বাংলা
বাংলা हिन्दी
 Čeština
 Українська
 Română

Gold price continues to trade sideways. Trend remains neutral as Gold price is moving above and below the Ichimoku cloud in an overlapping structure. Gold price is vulnerable to the downside but I remain longer-term bullish.
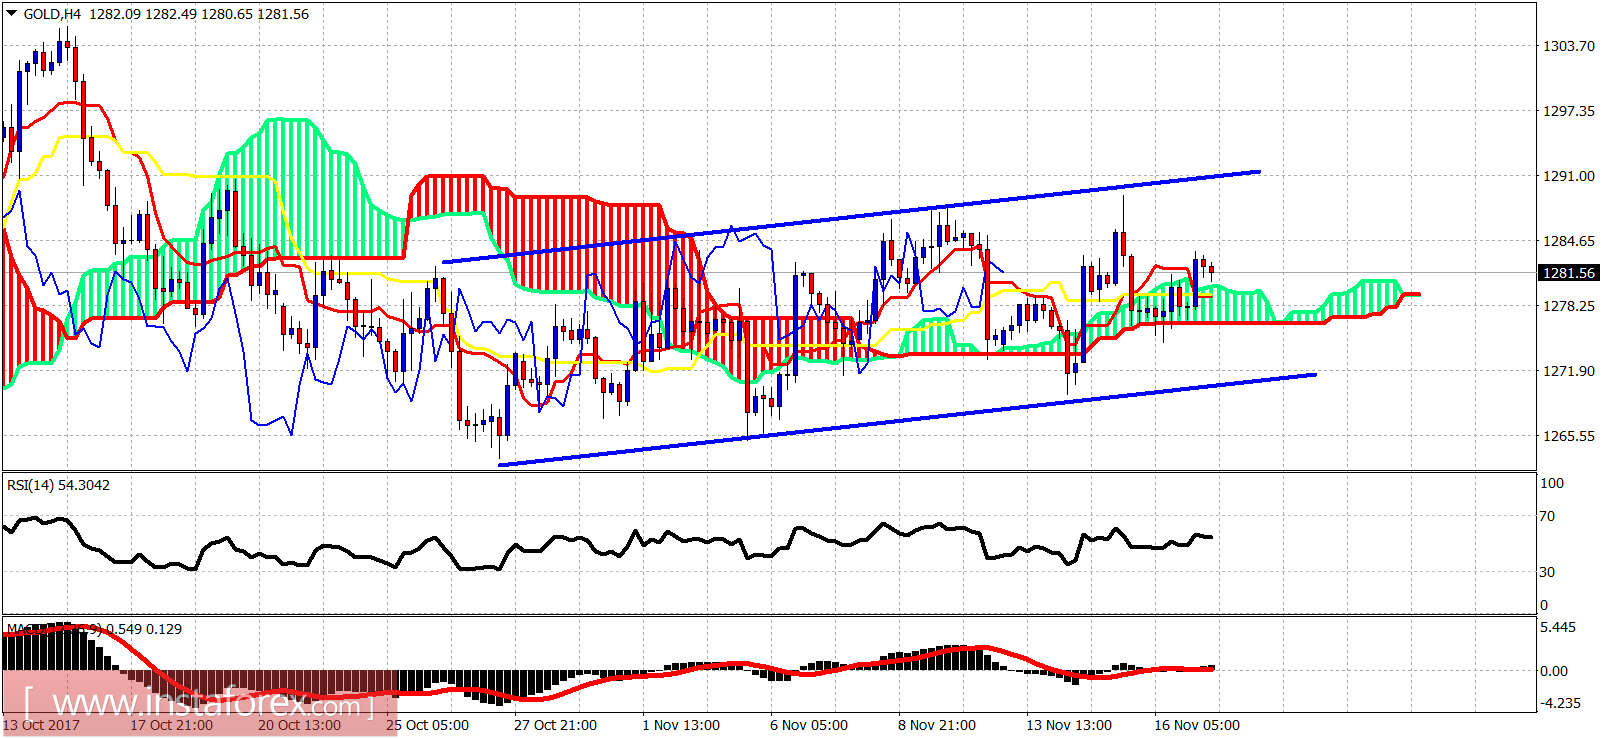
Gold price is above the Ichimoku cloud. However this does not give us a clear signal because price is moving sideways and is trapped in a trading range. Support is at $1,276. Breaking below this support level will open the way for a move below $1,262. Resistance is at $1,288-89. Breaking above that level will push price towards $1,300-$1,305.
Blue line - support
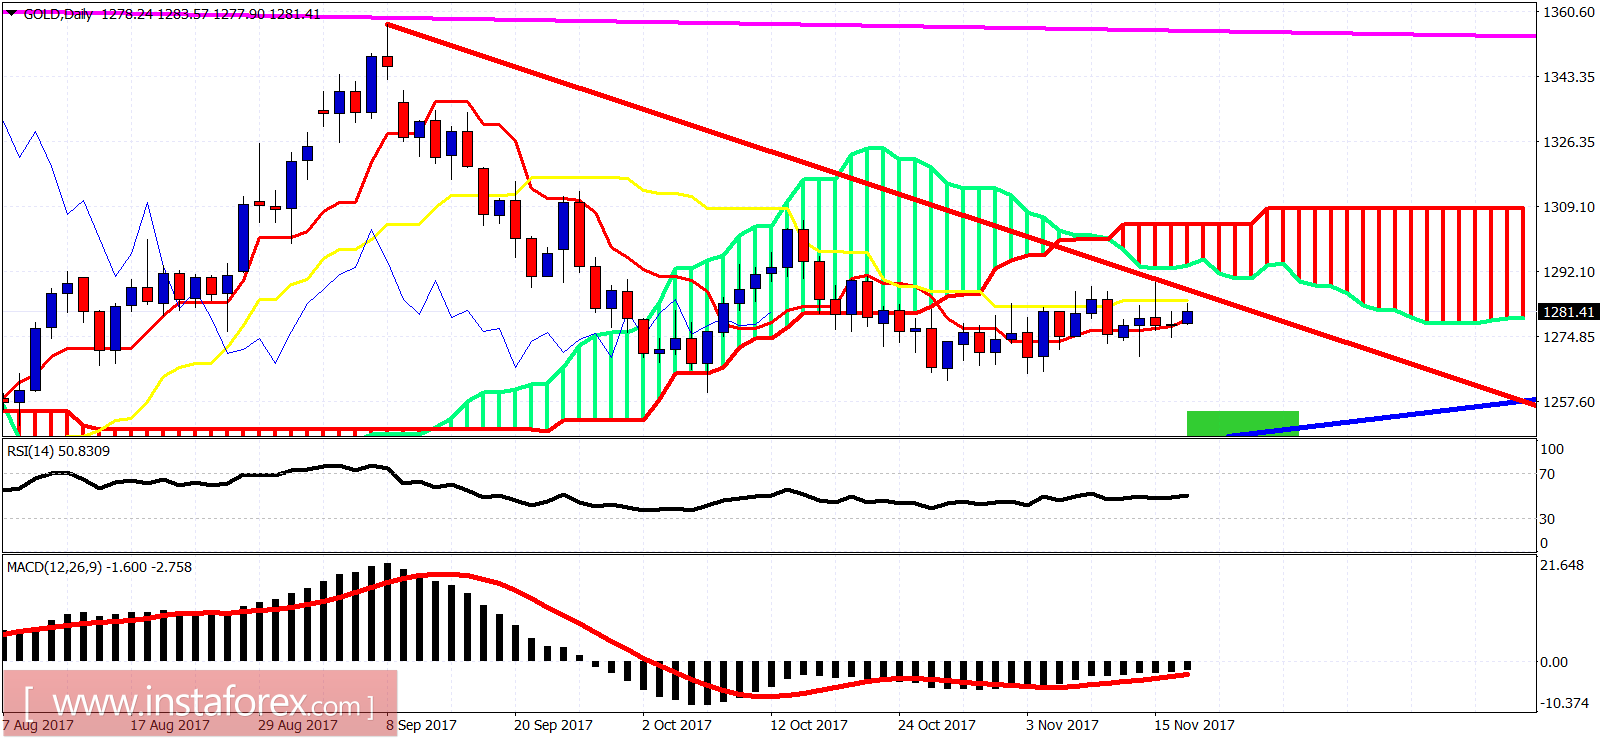
Magenta line -long-term resistance
Gold price is moving sideways since late October. Both tenkan- and kijun-sen are moving horizontally and this portrays the neutral trend very clearly. I can see Gold falling towards the green rectangle area of $1,250-45 before resuming the uptrend. Longer-term view remains bullish.