English
  Русский
 Bahasa Indonesia
 Bahasa Malay
 ไทย
ไทย Español
 Deutsch
 Български
 Français
 Tiếng Việt
 中文
中文 বাংলা
বাংলা हिन्दी
 Čeština
 Українська
 Română

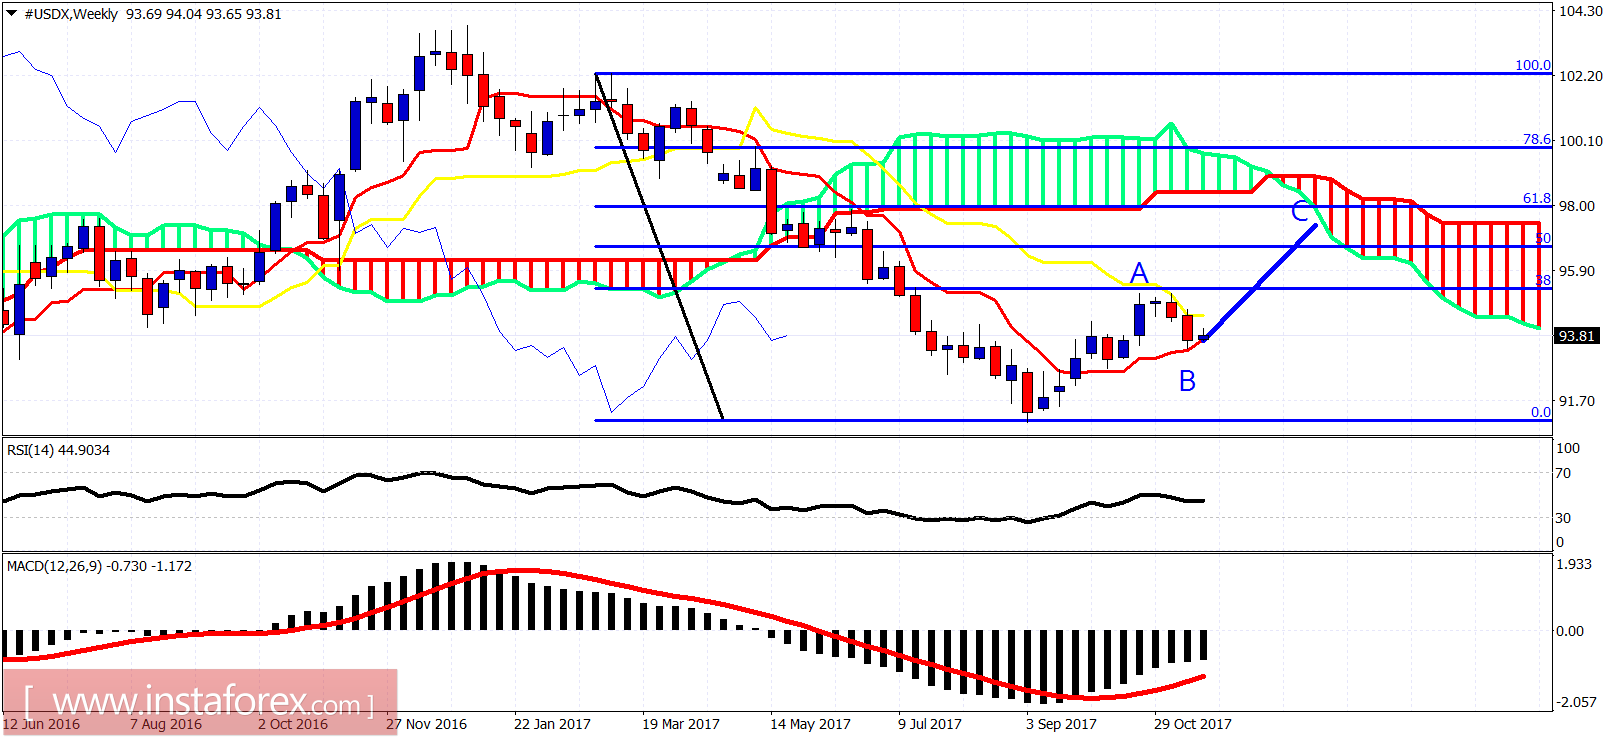
The Dollar index has stopped at the 38% Fibonacci retracement support as we noted in our latest analysis. This is a good support are where we could at least see a trade-able bounce. The Dollar index could still make a new lower low towards 93 before the bounce, but overall we should not ignore the bullish alternative wave counts.
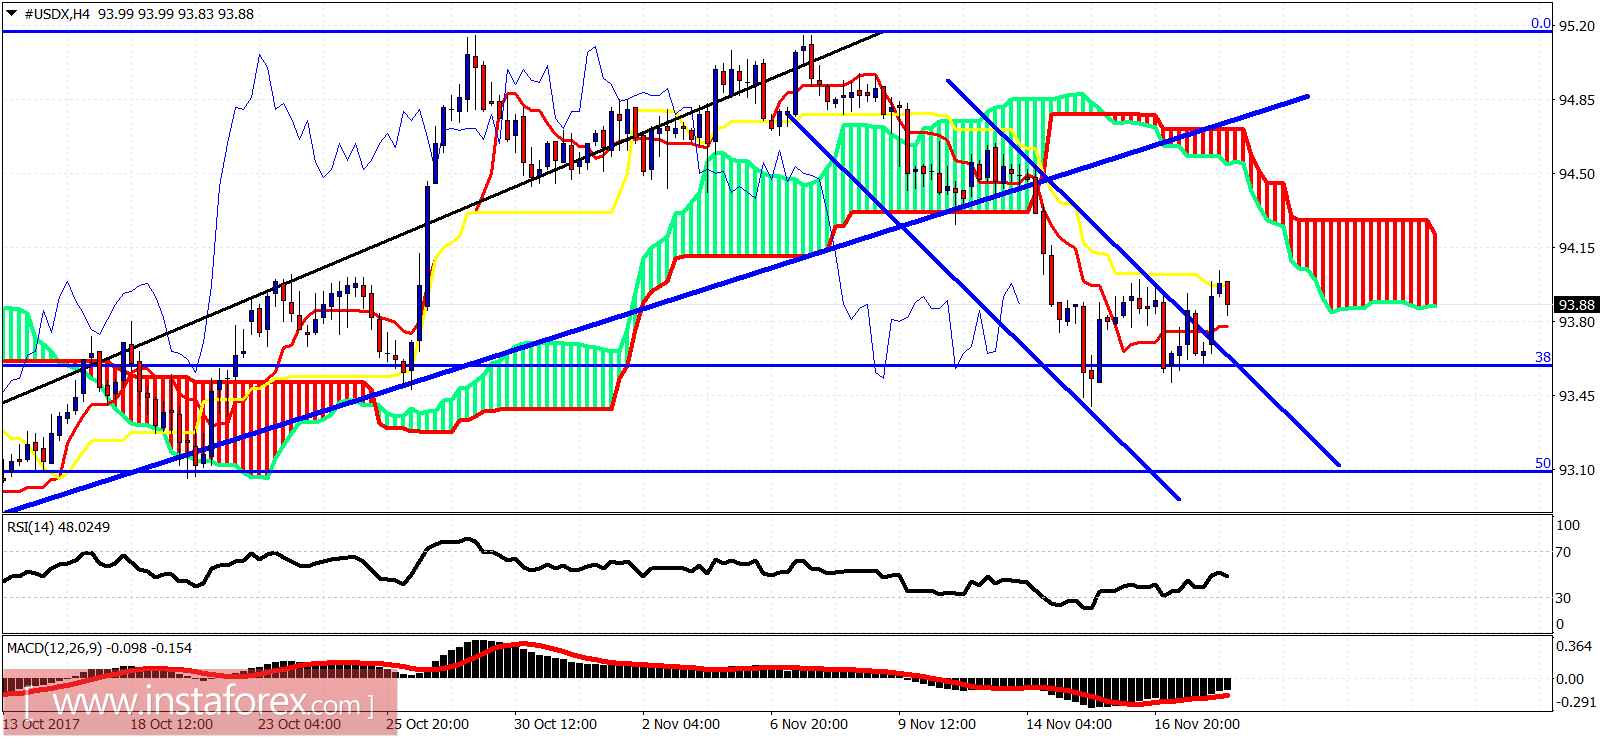
The Dollar index has broken out of the bearish channel. Is is a first bullish sign for a possible bounce. Price is below the Ichimoku cloud. Resistance is at 94.50. The decline so far is corrective in three waves, as the rise from September lows can be seen as impulsive. This implies that another leg higher is expected to follow.