 English
  Русский
 Bahasa Indonesia
 Bahasa Malay
 ไทย
ไทย Español
 Deutsch
 Български
 Français
 Tiếng Việt
 中文
中文 বাংলা
বাংলা हिन्दी
 Čeština
 Українська
 Română

GBP/USD has been following a bullish sequence that targets the resistance zone of 1.3309, at which we could expect some pullbacks to take place in order to correct the cycle started since November 13th session. With a breakout above 1.3309 the ground will be ready to reach the 1.3360 zone. MACD indicator remains in the negative territory.
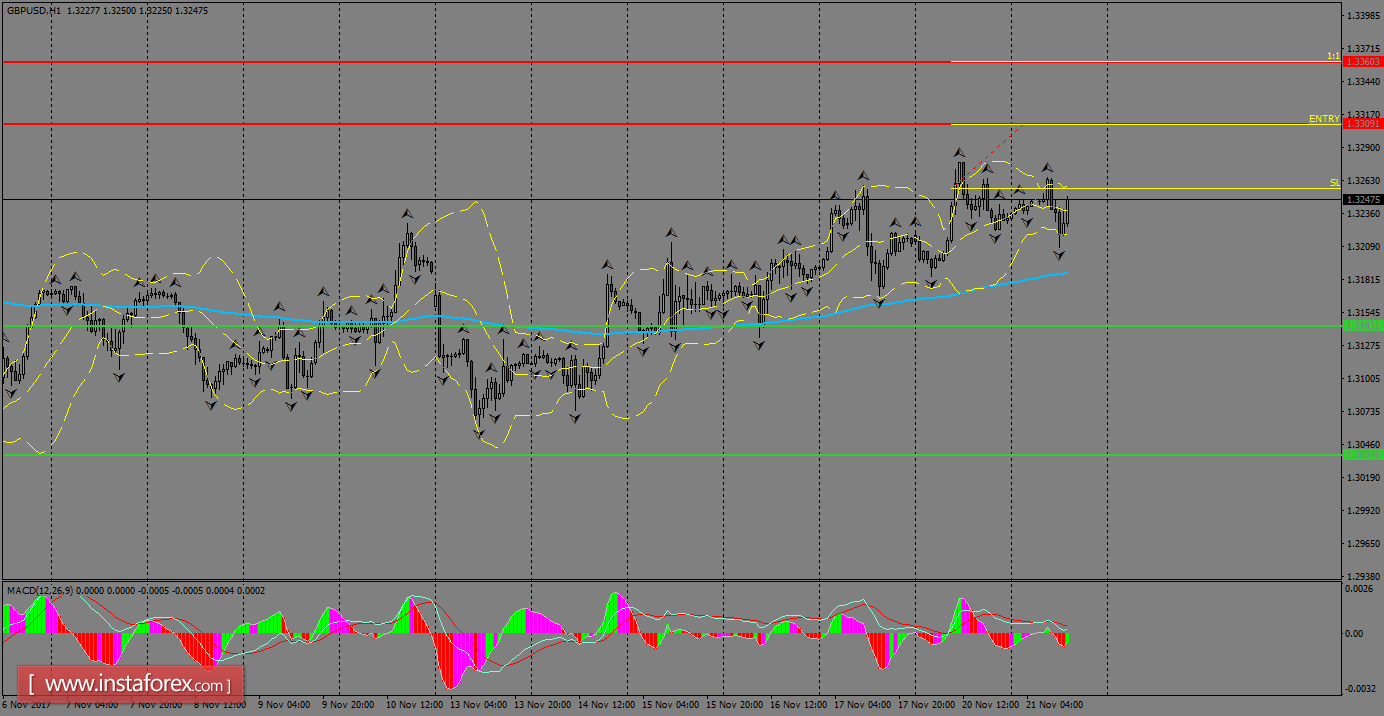
H1 chart's resistance levels: 1.3309 / 1.3360
H1 chart's support levels: 1.3143 / 1.3037
Trading recommendations for today: Based on the H1 chart, buy (long) orders only if the GBP/USD pair breaks a bullish candlestick; the resistance level is at 1.3309, take profit is at 1.3360 and stop loss is at 1.3256.