 English
  Русский
 Bahasa Indonesia
 Bahasa Malay
 ไทย
ไทย Español
 Deutsch
 Български
 Français
 Tiếng Việt
 中文
中文 বাংলা
বাংলা हिन्दी
 Čeština
 Українська
 Română

USDX is trying to extend the recovery made from the support zone of 93.55 and it's finding dynamic resistance in the 200 SMA at H1 chart. Such area is expected to provide offers in the index in order to resume the bearish path in the short-term. If the support mentioned above gives up, the next hurdle to face is located at the 93.12 level.
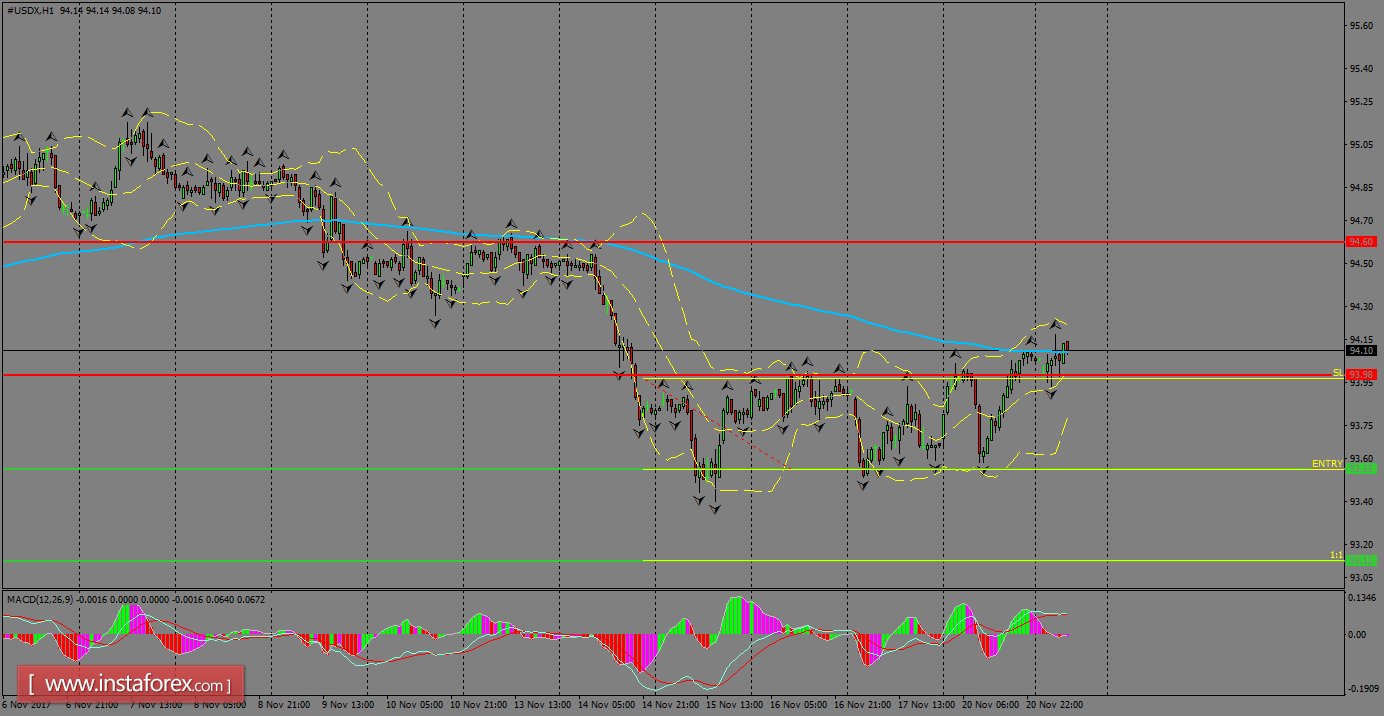
H1 chart's resistance levels: 93.98 / 94.60
H1 chart's support levels: 93.55 / 93.12
Trading recommendations for today: Based on the H1 chart, place sell (short) orders only if the USD Index breaks with a bearish candlestick; the support level is at 93.55, take profit is at 93.12 and stop loss is at 93.97.