 English
  Русский
 Bahasa Indonesia
 Bahasa Malay
 ไทย
ไทย Español
 Deutsch
 Български
 Français
 Tiếng Việt
 中文
中文 বাংলা
বাংলা हिन्दी
 Čeština
 Українська
 Română

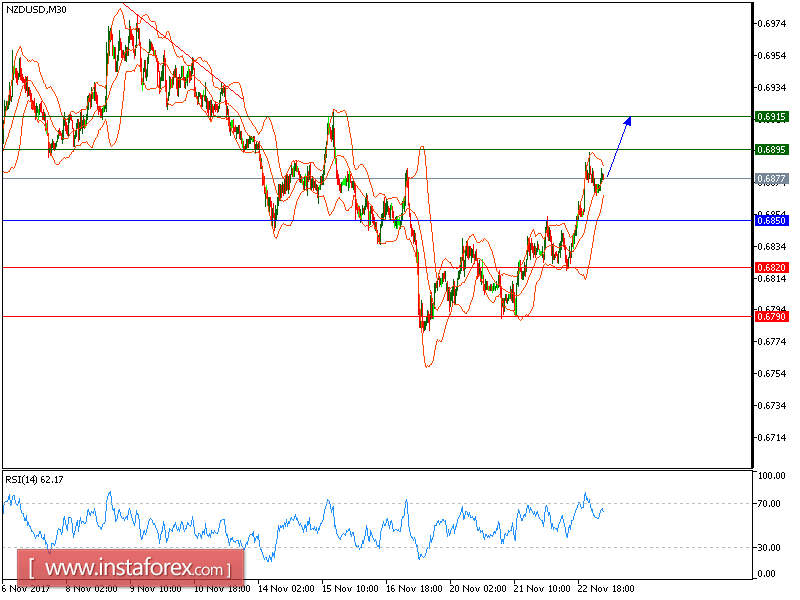
All our targets which we predicted yesterday have been hit. NZD/USD still expected to trade in a higher range. The pair is holding on the upside and is trading above its ascending 20-period and 50-period moving averages. The relative strength index calls for a further rise. The downside potential should be limited by the key support at 0.6850.
Hence, as long as this key level is not broken, look for a new challenge to 0.6895 and even to 0.6915 in extension.
The black line shows the pivot point. Currently, the price is above the pivot point, which indicates long positions. If it remains below the pivot point, it will indicate short positions. The red lines are showing the support levels and the green line is indicating the resistance levels. These levels can be used to enter and exit trades.
Resistance levels: 0.6895, 0.6915, and 0.6950
Support levels: 0.6820, 0.6790, and 0.6750