English
  Русский
 Bahasa Indonesia
 Bahasa Malay
 ไทย
ไทย Español
 Deutsch
 Български
 Français
 Tiếng Việt
 中文
中文 বাংলা
বাংলা हिन्दी
 Čeština
 Українська
 Română

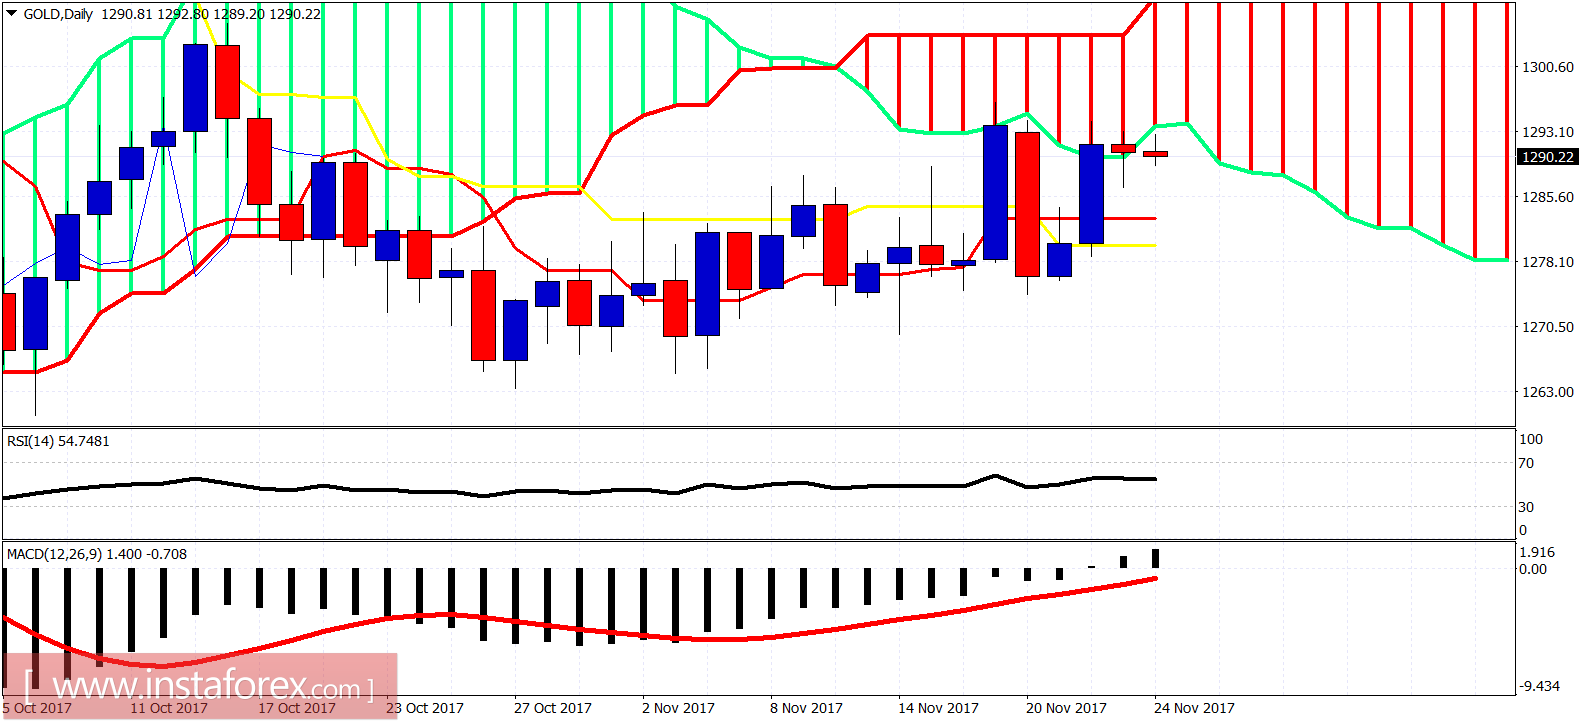
Gold price remains inside the sideways channel just below important resistance levels. I continue to expect Gold to move lower towards $1,250 before resuming the longer-term upward move.
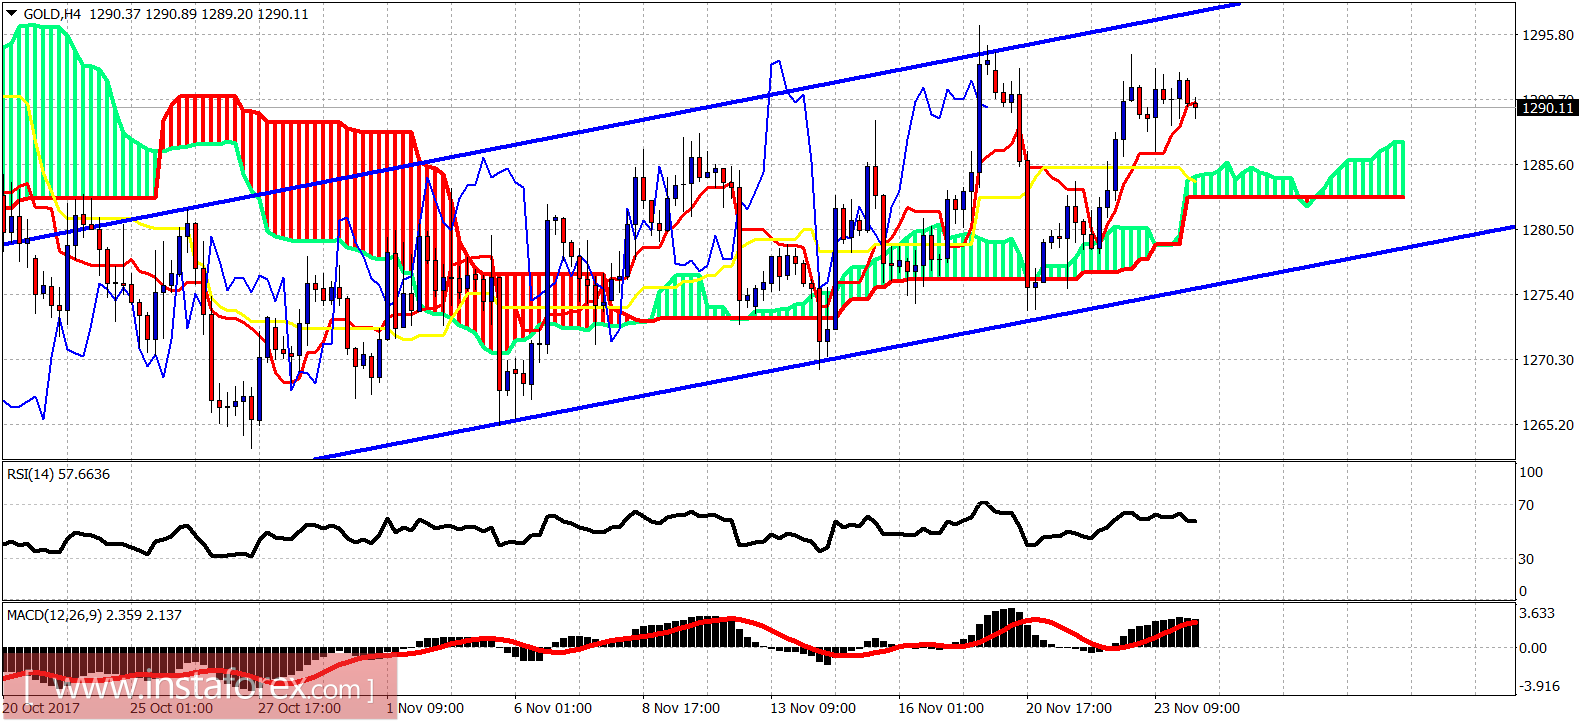
Blue lines - trading range
The Gold price is above the Ichimoku cloud in the 4 hour chart. This is a bullish sign. Support is at $1,285 and next at $1,277. Resistance is at $1,294 and next at $1,300. Gold is making an overlapping upward move since late October lows. This is not impulsive price action.