 English
  Русский
 Bahasa Indonesia
 Bahasa Malay
 ไทย
ไทย Español
 Deutsch
 Български
 Français
 Tiếng Việt
 中文
中文 বাংলা
বাংলা हिन्दी
 Čeština
 Українська
 Română

Overview:
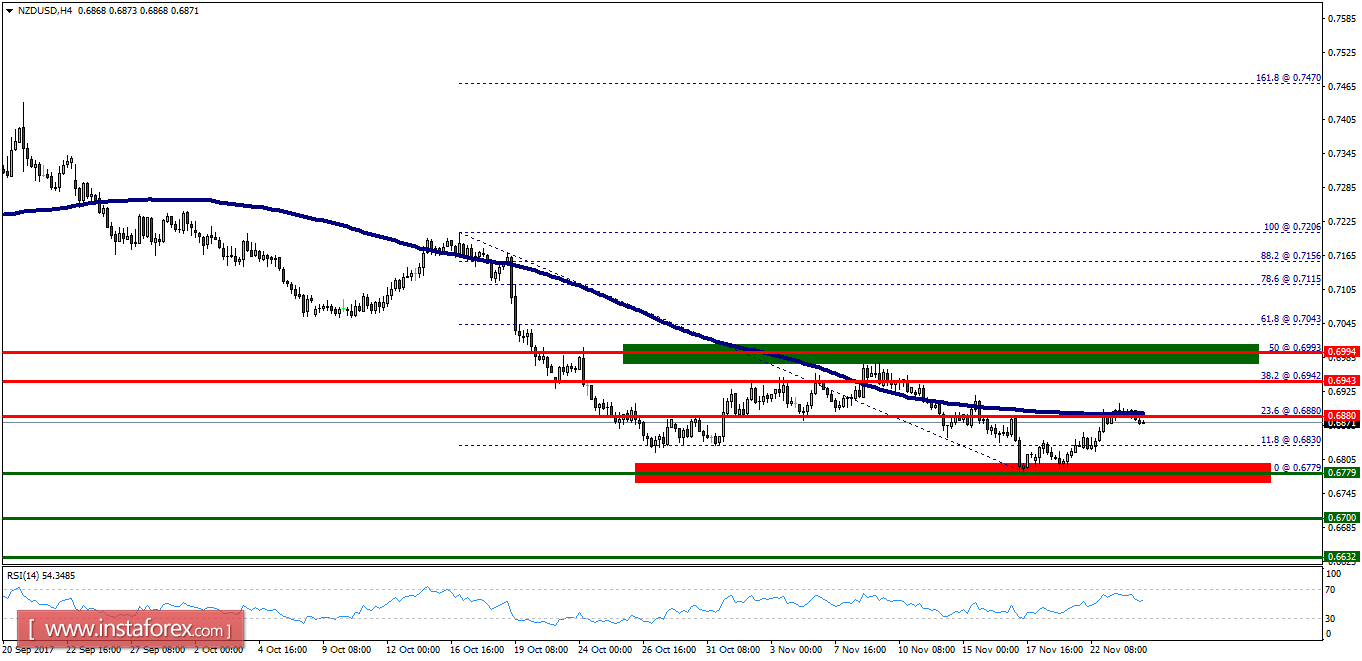
- Currently price is seen at the point of 0.6772 on the H1 and H4 charts. The NZD/USD pair continues rising from the level of 0.6779 in the long term. It should be noted that the support is established at the level of 0.6779 which represents thedoule bottom on the H4 chart. The price is likely to form a double bottom in the same time frame. Accordingly, the NZD/USD pair is showing signs of strength following a breakout of the highest level of 0.6880. So, buy above the level of 0.6880 with the first target at 0.6943 in order to test the daily resistance 1 and further to 0.6940. Also, it might be noted that the level of 0.6940 is a good place to take profit because it will form a double top.
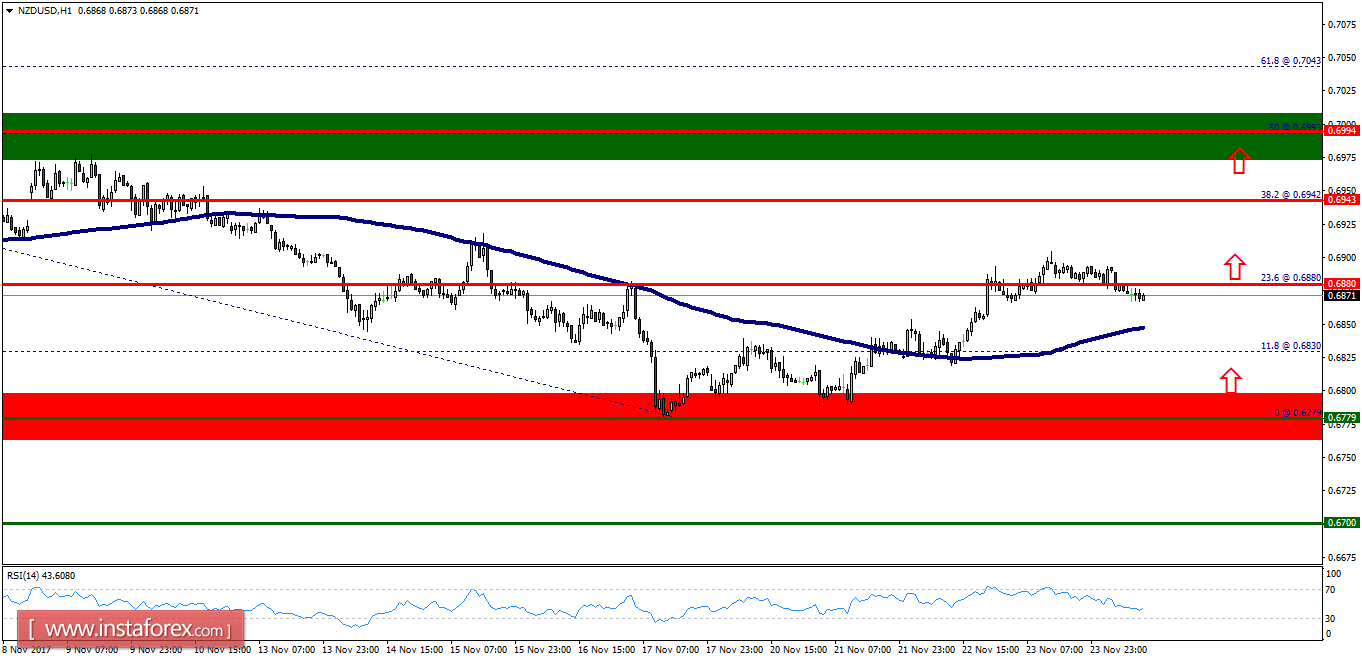
- However, in case a reversal takes place and the NZD/USD pair breaks through the support level of 0.6779, a further decline to 0.6632 can occur which would indicate a bearish market.