English
  Русский
 Bahasa Indonesia
 Bahasa Malay
 ไทย
ไทย Español
 Deutsch
 Български
 Français
 Tiếng Việt
 中文
中文 বাংলা
বাংলা हिन्दी
 Čeština
 Українська
 Română

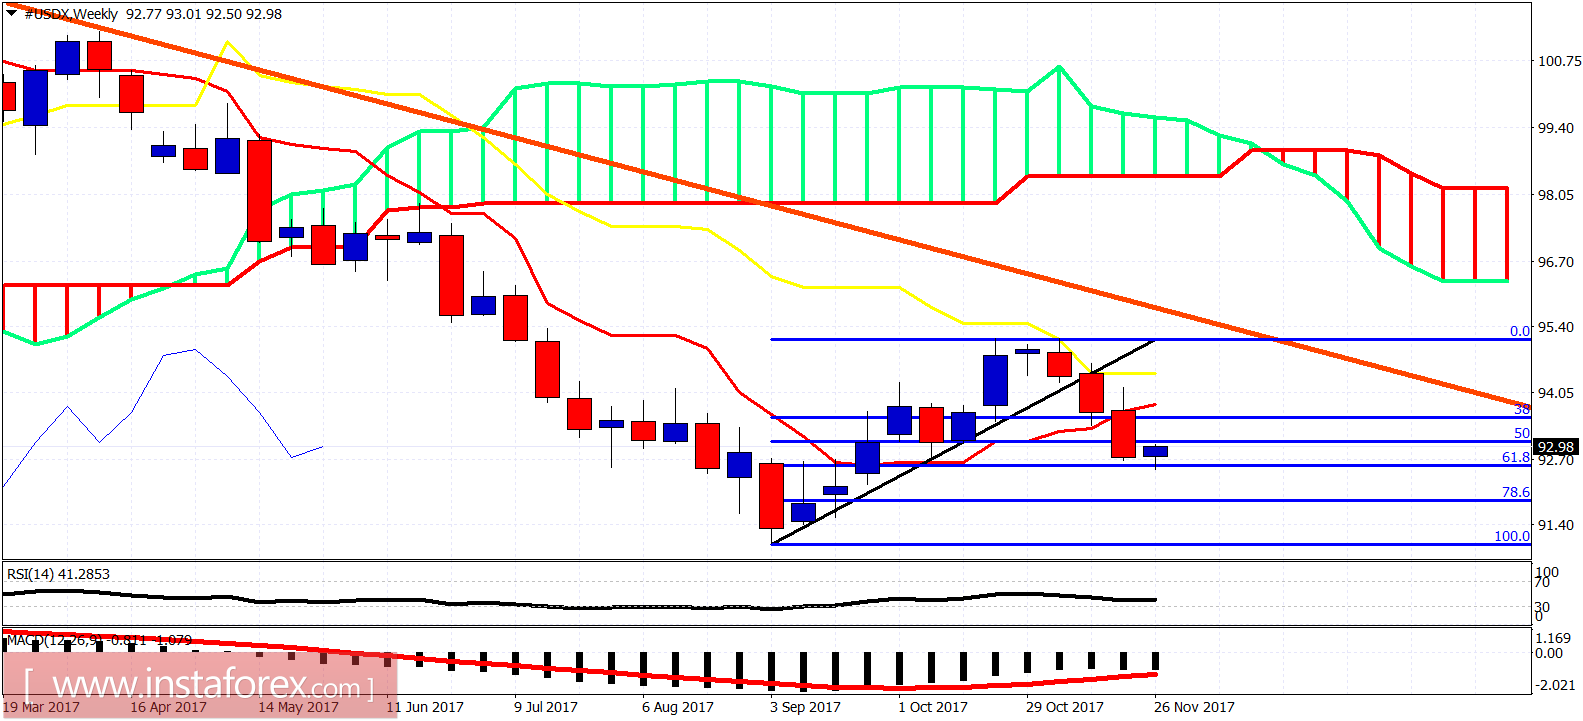
The Dollar index as expected is bouncing and reversing its course off the 61.8% Fibonacci retracement and the 92.50 level which was our target. I believe that we are now in the early stages of the next upward move towards 97. Worst case scenario for bulls would be a shallow bounce towards 94 and a rejection.
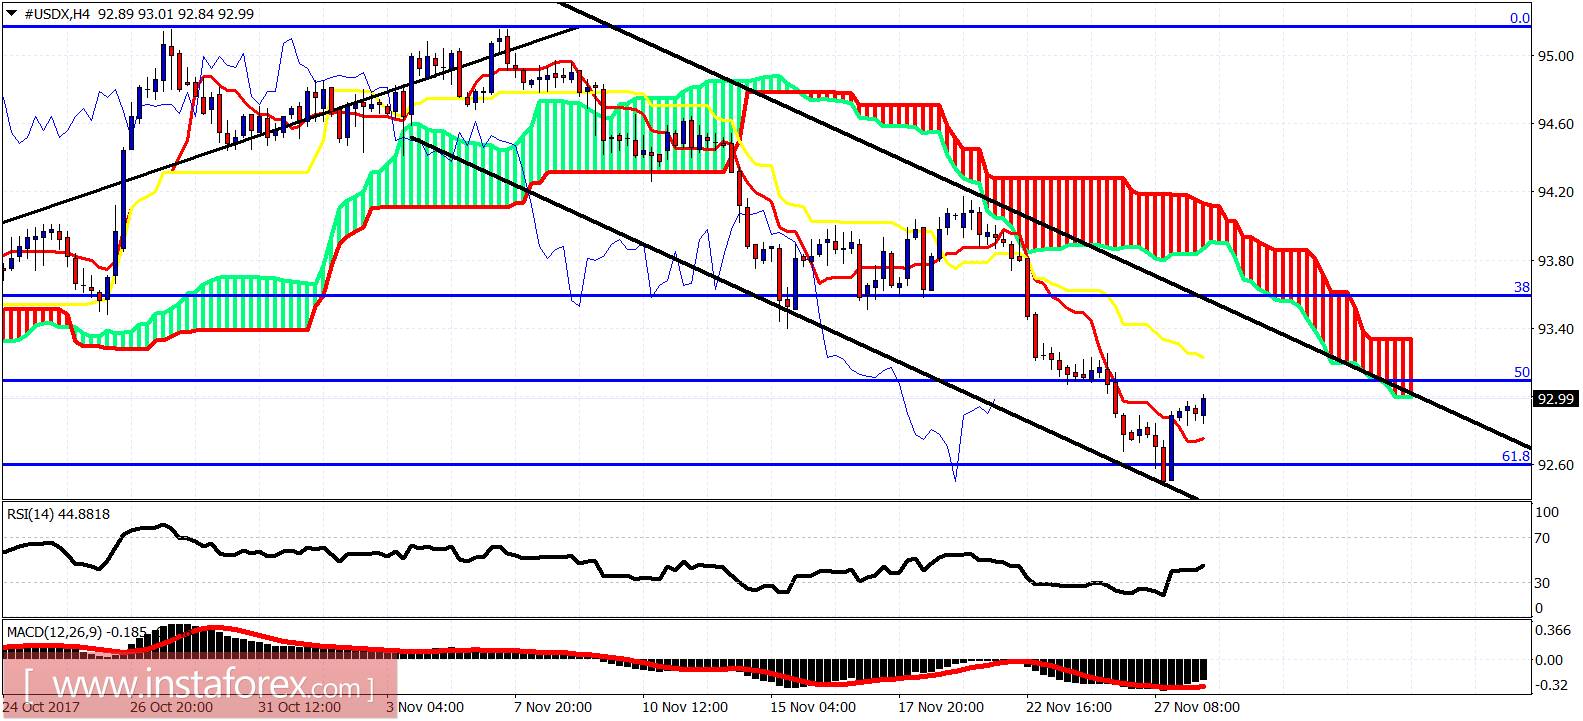
Black lines - bearish channel
The Dollar index is in a bearish trend as long as the price is below the 4 hour Kumo and inside the bearish channel. Short-term resistance is at 93.25 and next at 93.85. Support is at 92.75. Since yesterday price is showing reversal signs. A minimum bounce towards 93.80 is expected. However, my primary scenario is a bigger bounce to new highs above 95.