 English
  Русский
 Bahasa Indonesia
 Bahasa Malay
 ไทย
ไทย Español
 Deutsch
 Български
 Français
 Tiếng Việt
 中文
中文 বাংলা
বাংলা हिन्दी
 Čeština
 Українська
 Română

The pair is plummeting below the 1.3300 handle and it's testing the 200 SMA at the H1 chart, where bulls could appear once again in order to resume the mentioned path. To the downside, the support level of 1.3244 could be a solid hurdle to break before to reach the next level at 1.3143. MACD indicator remains in the negative territory, favoring to the bears.
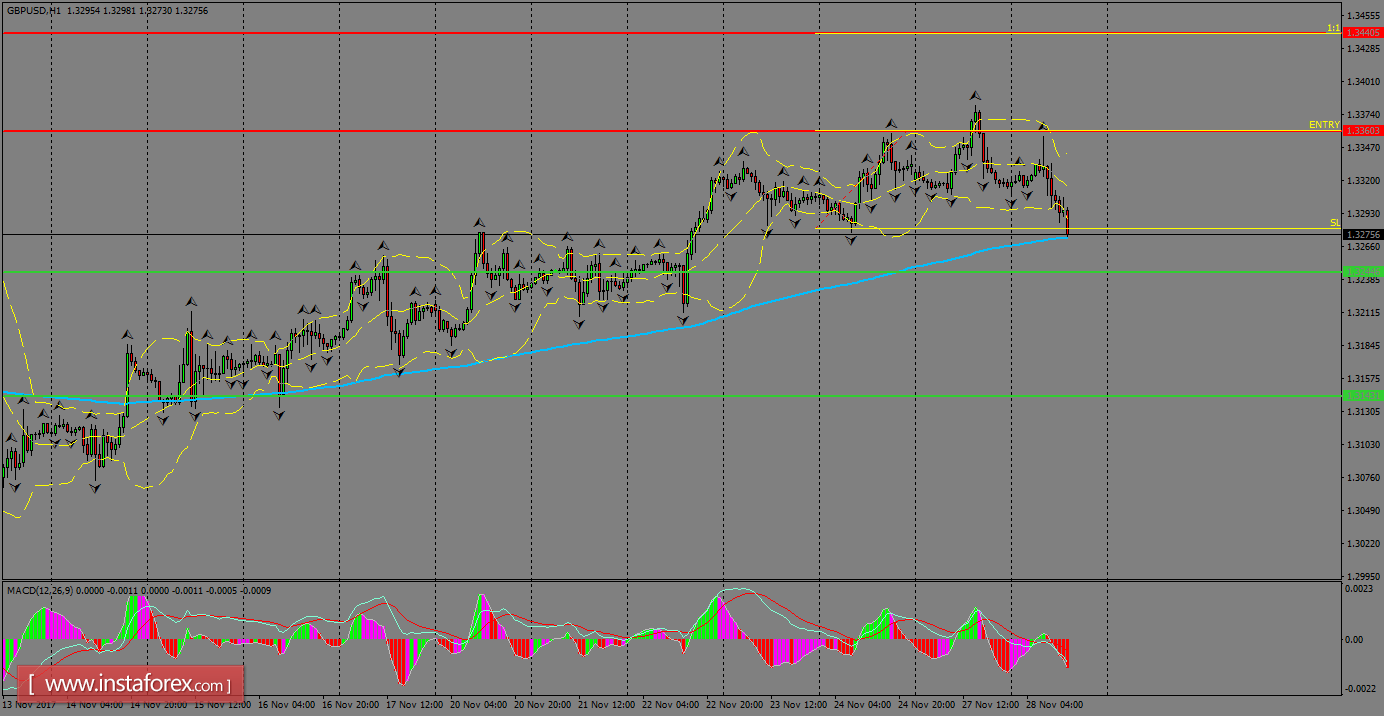
H1 chart's resistance levels: 1.3360 / 1.3440
H1 chart's support levels: 1.3244 / 1.3143
Trading recommendations for today: Based on the H1 chart, buy (long) orders only if the GBP/USD pair breaks a bullish candlestick; the resistance level is at 1.3360, take profit is at 1.3440 and stop loss is at 1.3280.