English
  Русский
 Bahasa Indonesia
 Bahasa Malay
 ไทย
ไทย Español
 Deutsch
 Български
 Français
 Tiếng Việt
 中文
中文 বাংলা
বাংলা हिन्दी
 Čeština
 Українська
 Română

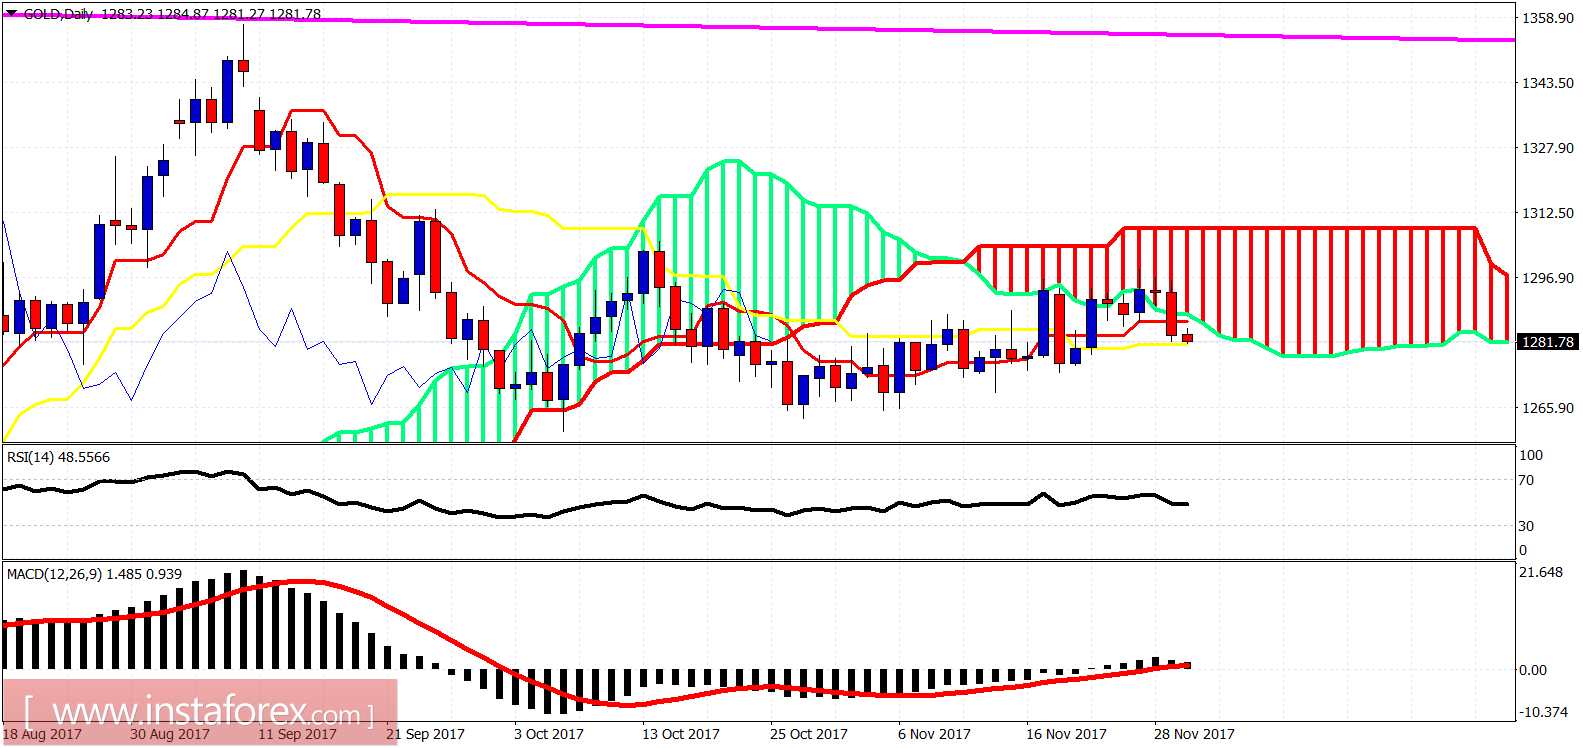
As expected, gold price got rejected at the upper channel boundary. The break below the black trend line support has given a new short-term sell signal that so far remains in profit as price has fallen towards the lower channel boundary and cloud support.
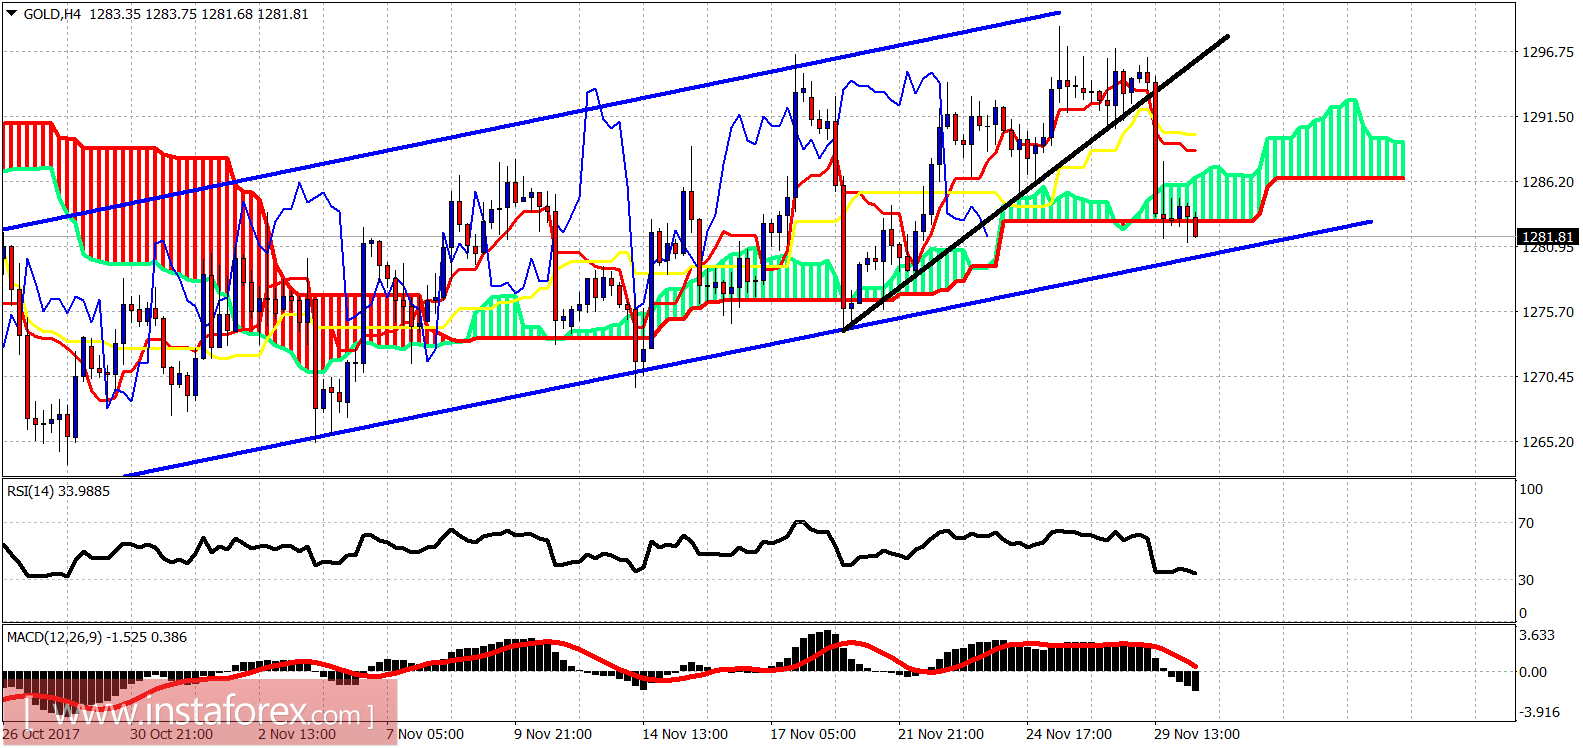
Black line - support (broken)
Gold price is breaking below the 4-hour Kumo support. Price is now testing the lower channel boundary. As I have been saying for the past few days, Gold price is expected to move sharply lower towards $1,250. A break below support of $1,280 will confirm that this move has started.