English
  Русский
 Bahasa Indonesia
 Bahasa Malay
 ไทย
ไทย Español
 Deutsch
 Български
 Français
 Tiếng Việt
 中文
中文 বাংলা
বাংলা हिन्दी
 Čeština
 Українська
 Română

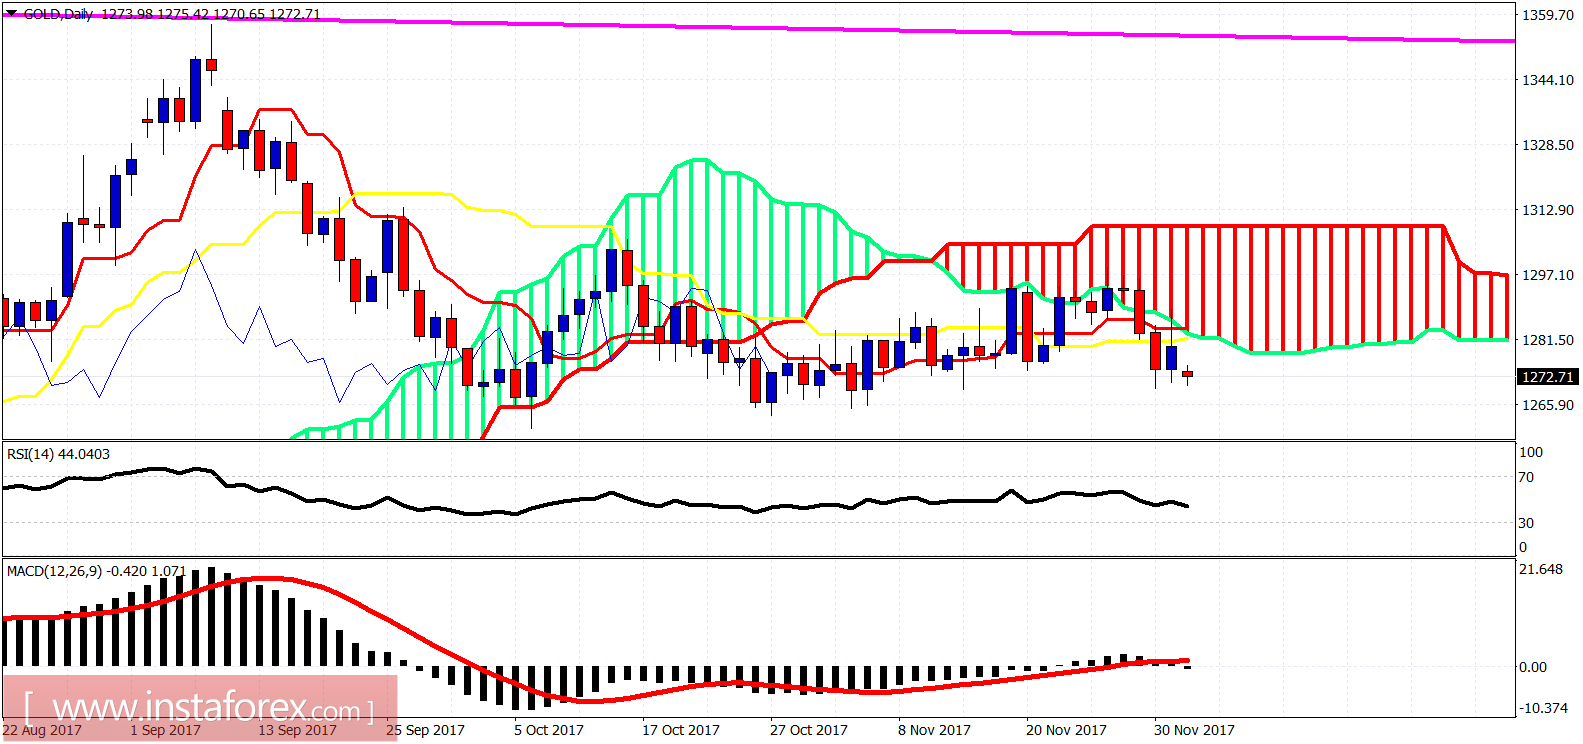
The Gold price has broken downwards. The price, as expected, got rejected below the $1,300 resistance area last week and is looking very bearish and ready to fall further towards our short-term $1,250 target. The Gold price bounced on Friday towards $1,285 as expected and is now re-testing recent lows.
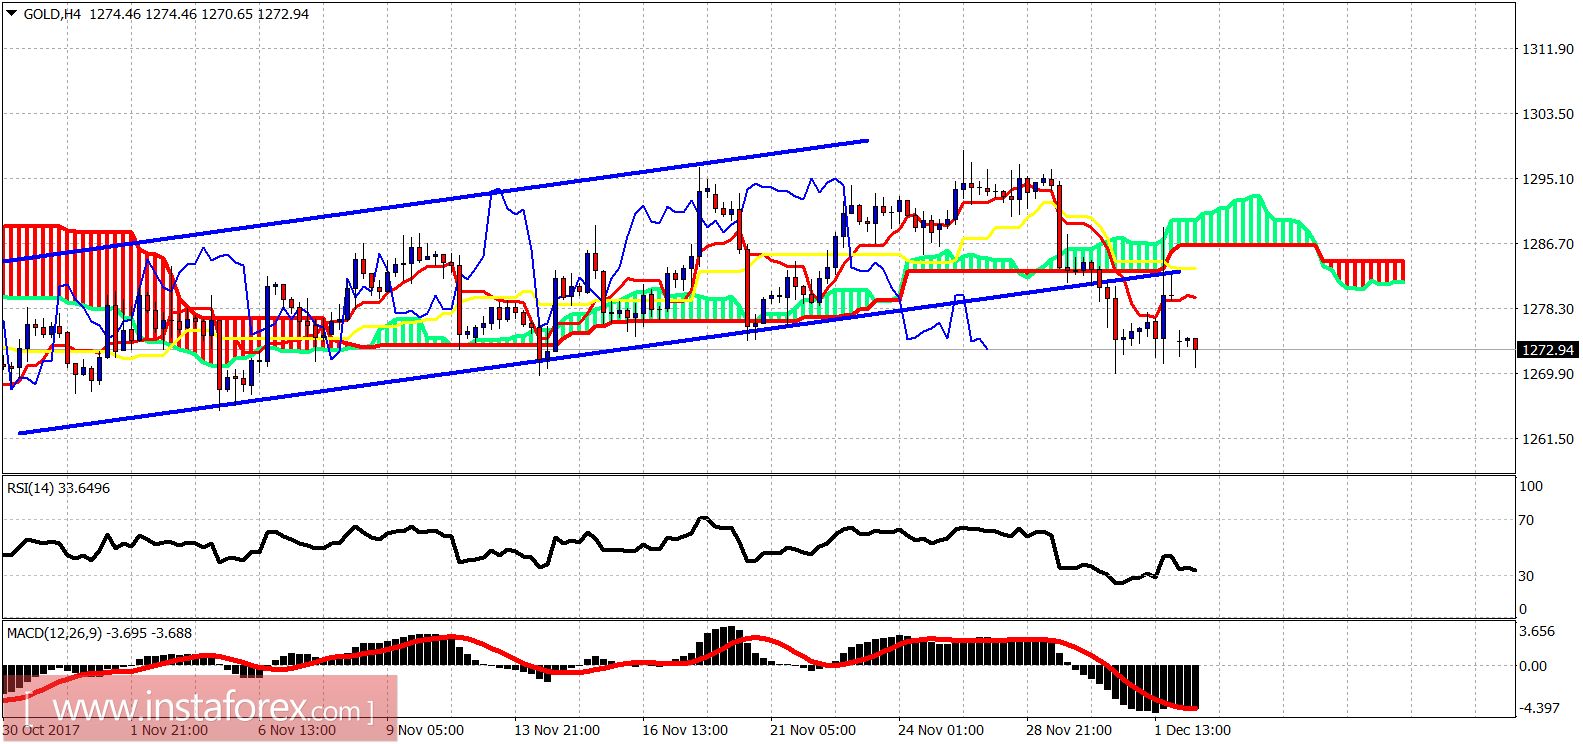
Blue lines - bullish channel (broken)
The Gold price has also broken below the 4-hour channel as expected. Price bounced on Friday towards cloud resistance and got rejected. The trend is bearish. Support is at $1,270 and next at $1,260. I expect both to be broken this week. Resistance is at $1,287-97 area. Only a break above this area will cancel my short-term view for a push lower towards $1,250.