English
  Русский
 Bahasa Indonesia
 Bahasa Malay
 ไทย
ไทย Español
 Deutsch
 Български
 Français
 Tiếng Việt
 中文
中文 বাংলা
বাংলা हिन्दी
 Čeština
 Українська
 Română

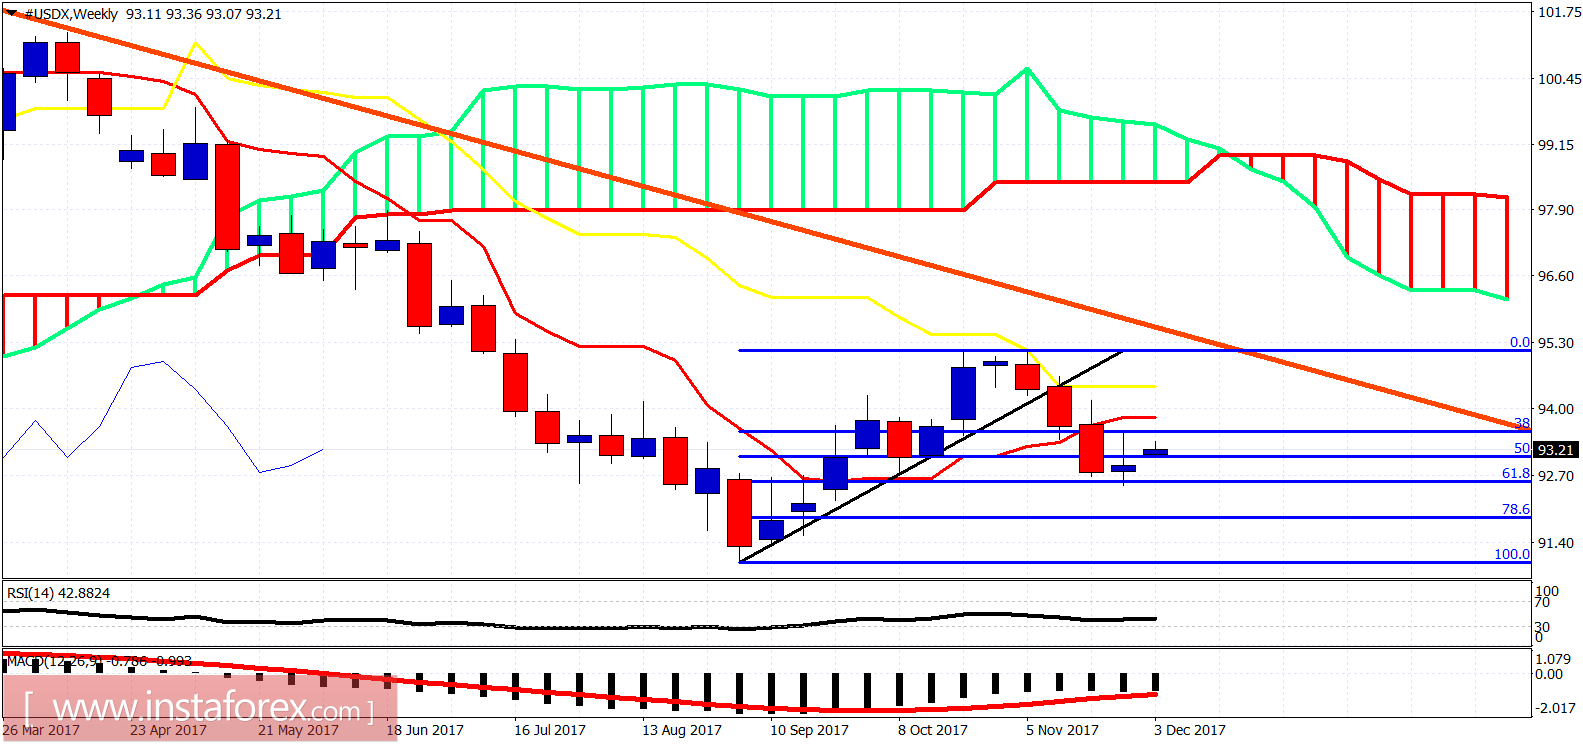
The Dollar index held above its recent lows and made a higher low on Friday. Although last week's close was not perfect for bulls, it was not bad either. We start the week with Dollar strength and for bulls to continue to have control, price must break above 93.30 resistance.
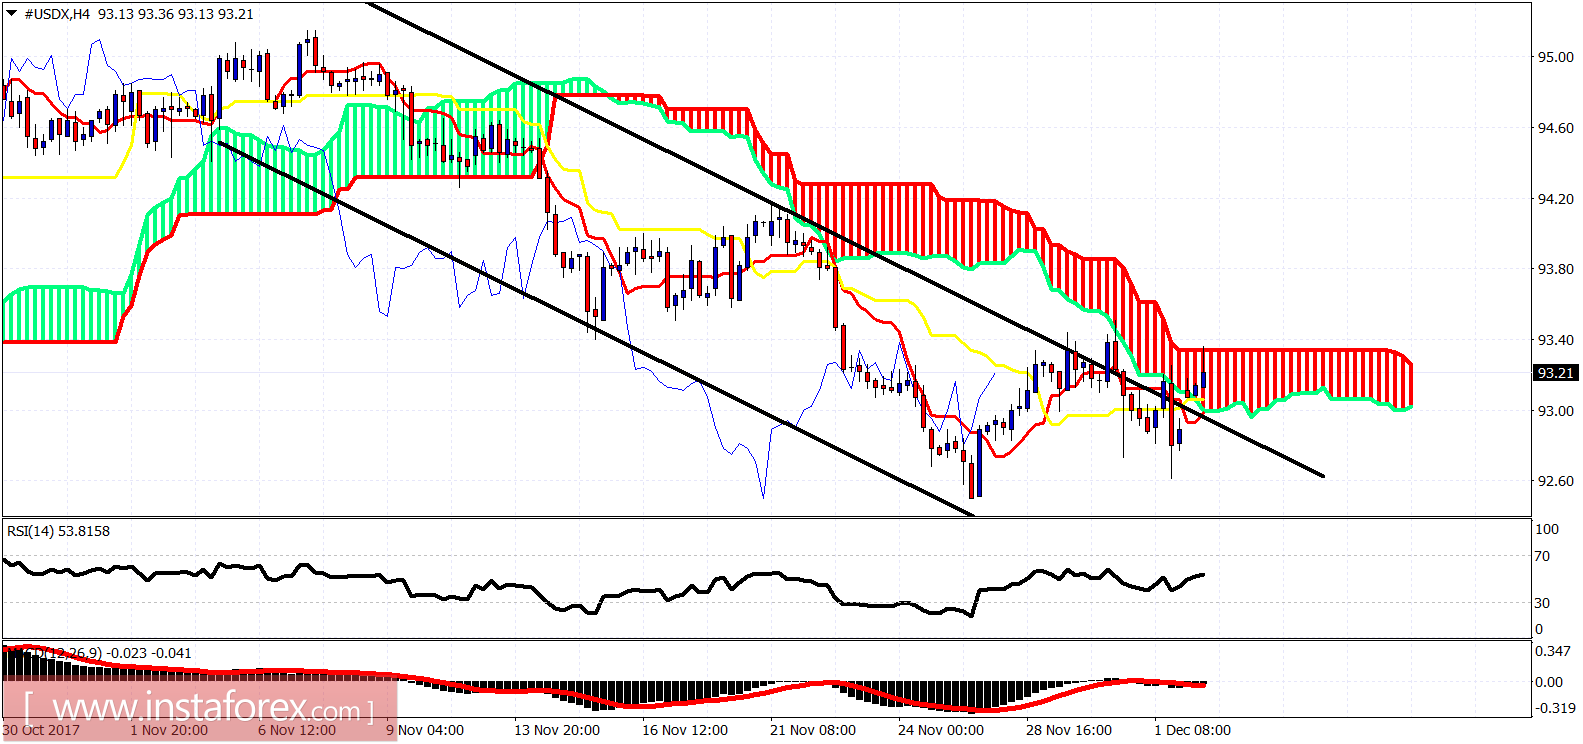
The Dollar index is trying to break above the Ichimoku cloud. Price is already above the bearish channel and has already made a higher low last week. Bulls need to step in now and push price above the 93.30 resistance by the Ichimoku cloud. Breaking above the resistance will increase the chances of a push towards 95-96.