 English
  Русский
 Bahasa Indonesia
 Bahasa Malay
 ไทย
ไทย Español
 Deutsch
 Български
 Français
 Tiếng Việt
 中文
中文 বাংলা
বাংলা हिन्दी
 Čeština
 Українська
 Română

There is a rally underway in the GBP/USD pair, after finding support around 1.3437. The next target to the upside should be the resistance zone of 1.3541 ahead of the 1.3612 level. However, we're expecting sideways moves in coming days, but bears should remain capped by the 200 SMA at H1 chart. MACD indicator still supports the bullish idea.
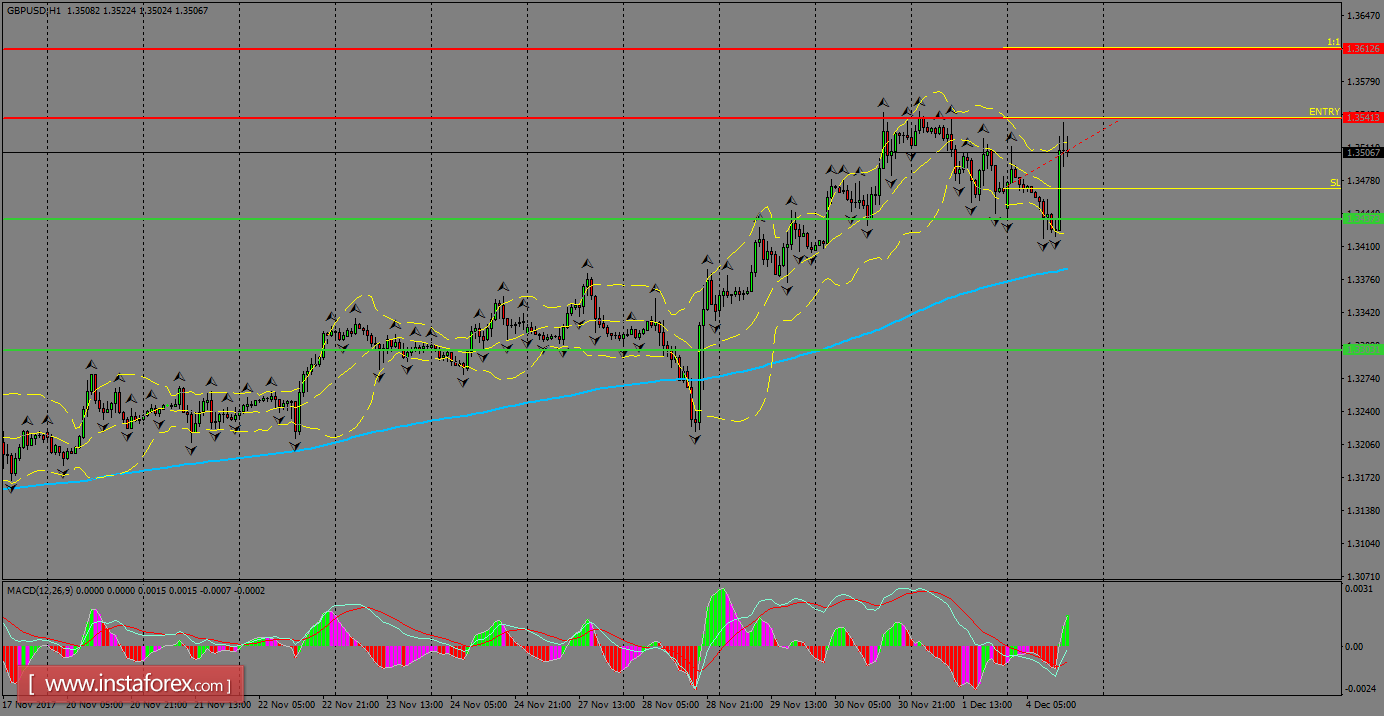
H1 chart's resistance levels: 1.3541 / 1.3612
H1 chart's support levels: 1.3437 / 1.3303
Trading recommendations for today: Based on the H1 chart, buy (long) orders only if the GBP/USD pair breaks a bullish candlestick; the resistance level is at 1.3541, take profit is at 1.3612 and stop loss is at 1.3466.