English
  Русский
 Bahasa Indonesia
 Bahasa Malay
 ไทย
ไทย Español
 Deutsch
 Български
 Français
 Tiếng Việt
 中文
中文 বাংলা
বাংলা हिन्दी
 Čeština
 Українська
 Română

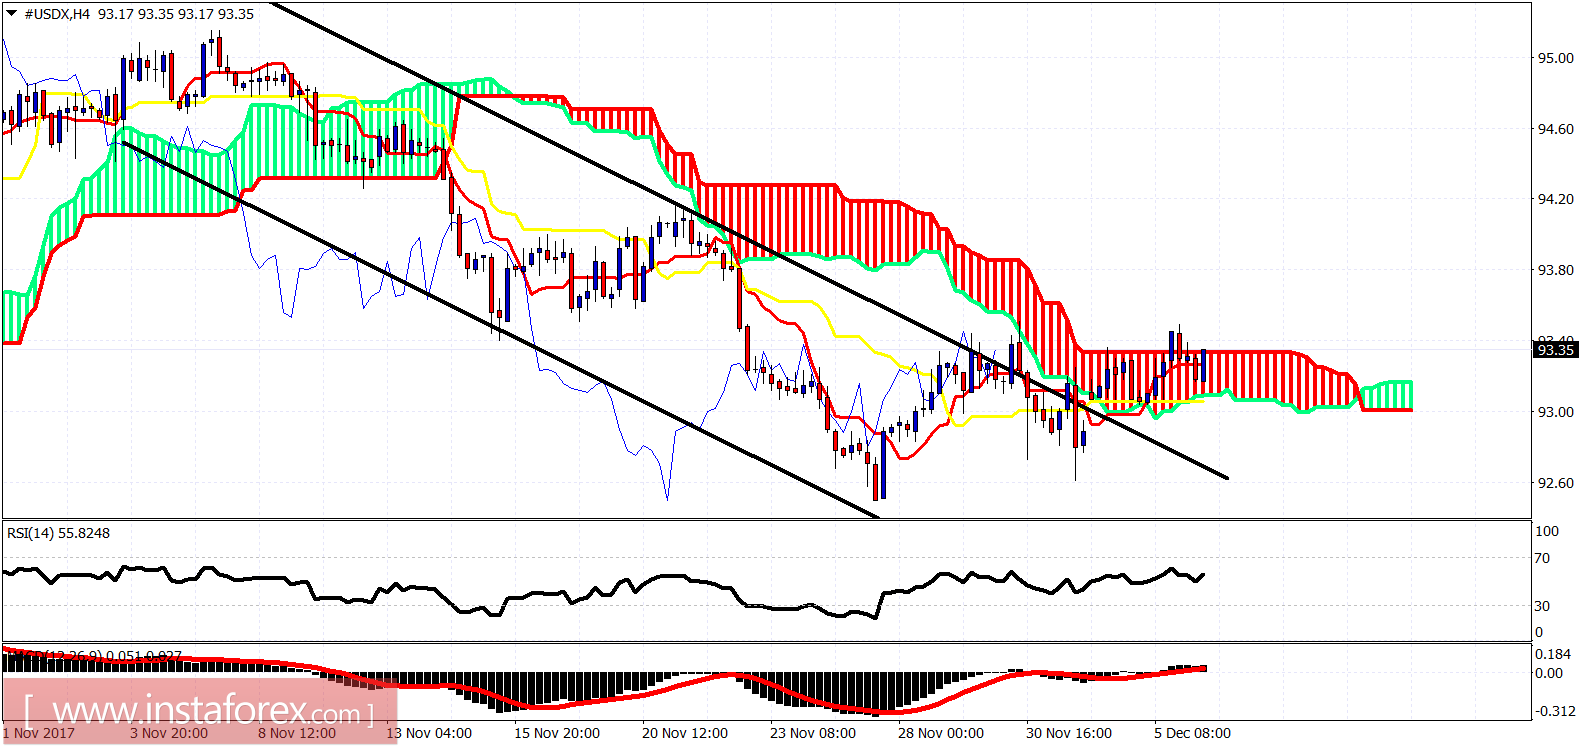
The Dollar index is moving higher as expected. Price briefly broke above cloud resistance yesterday but moved back inside the cloud. Today I expect the Dollar index to confirm the short-term bullish trend by breaking above 93.50.
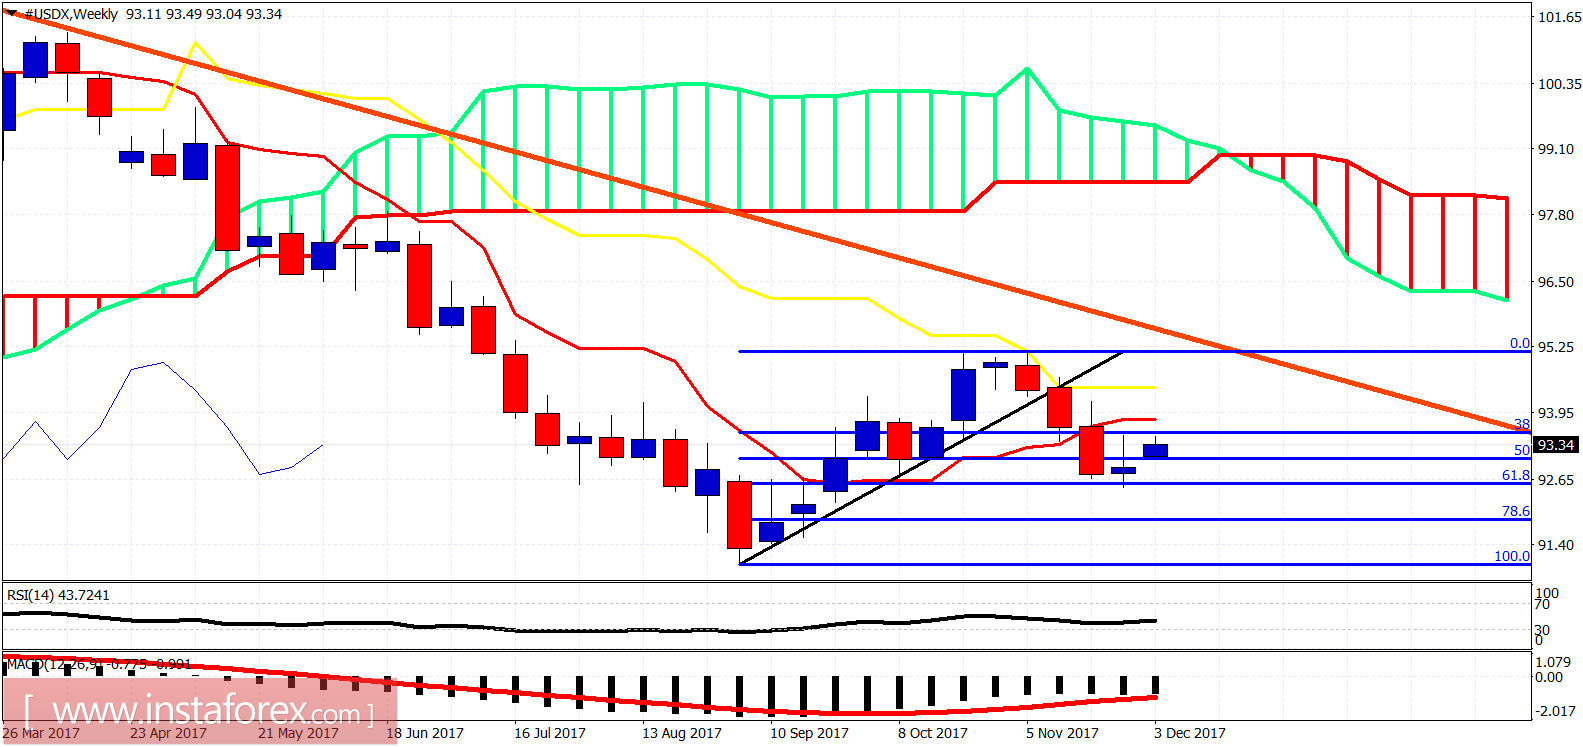
The Dollar index is inside the 4-hour Kumo (cloud). Trend is neutral but price is about to break above the cloud and change to bullish. Price has made an important reversal from our 92.50 target area. We are Dollar bullish looking for a test of November- October highs.