The US dollar index has broken out of the bearish Kumo cloud resistance. Trend is changing to bullish as long as price is above 93-92.50. The index has started making higher highs and higher lows on the 4 hour chart.
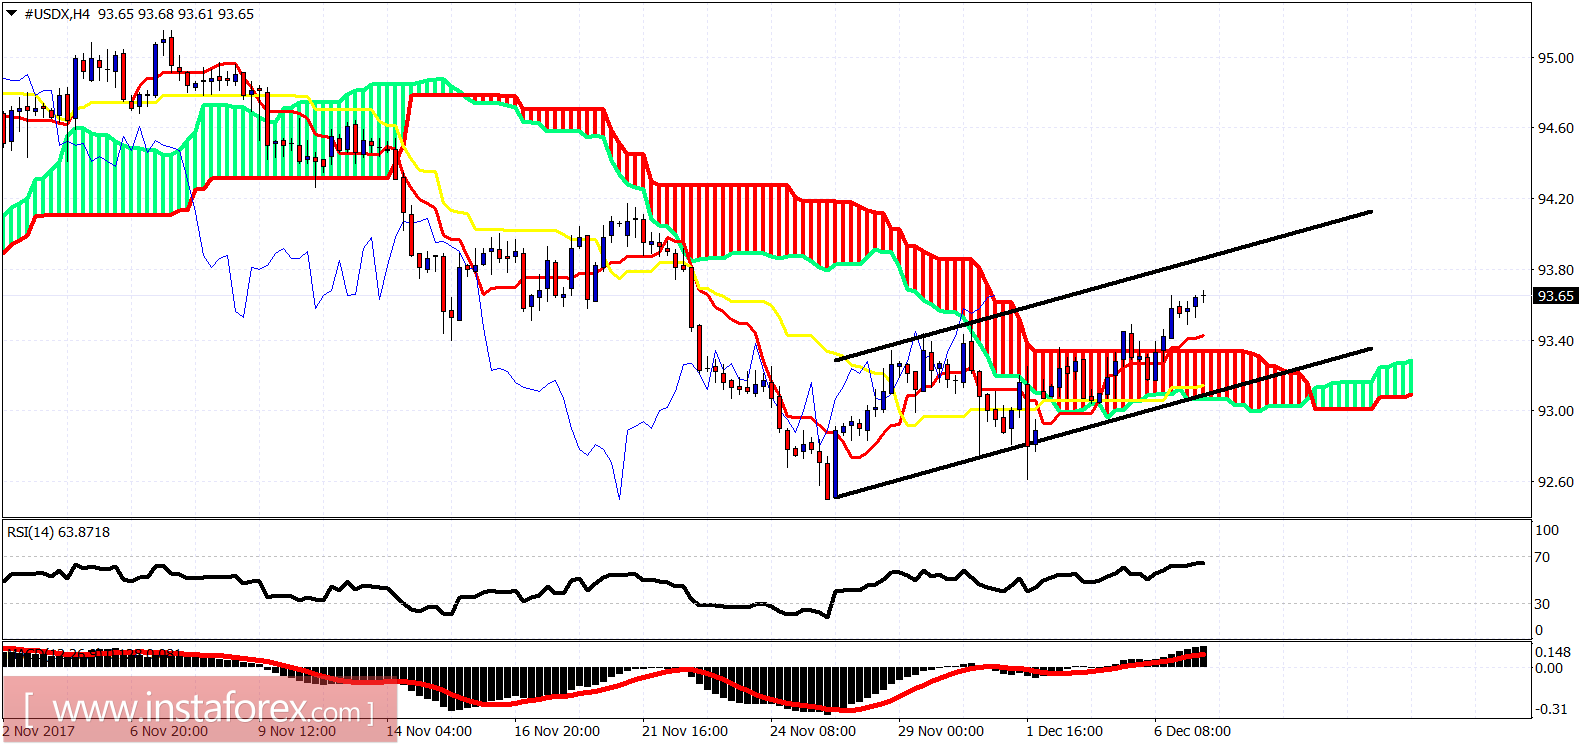
Black lines - bullish channel
The Dollar index is trading above the Ichimoku cloud. Price is inside the bullish short-term channel. Support is found at 93.30 while the resistance lies at 93.80. Trend is bullish.
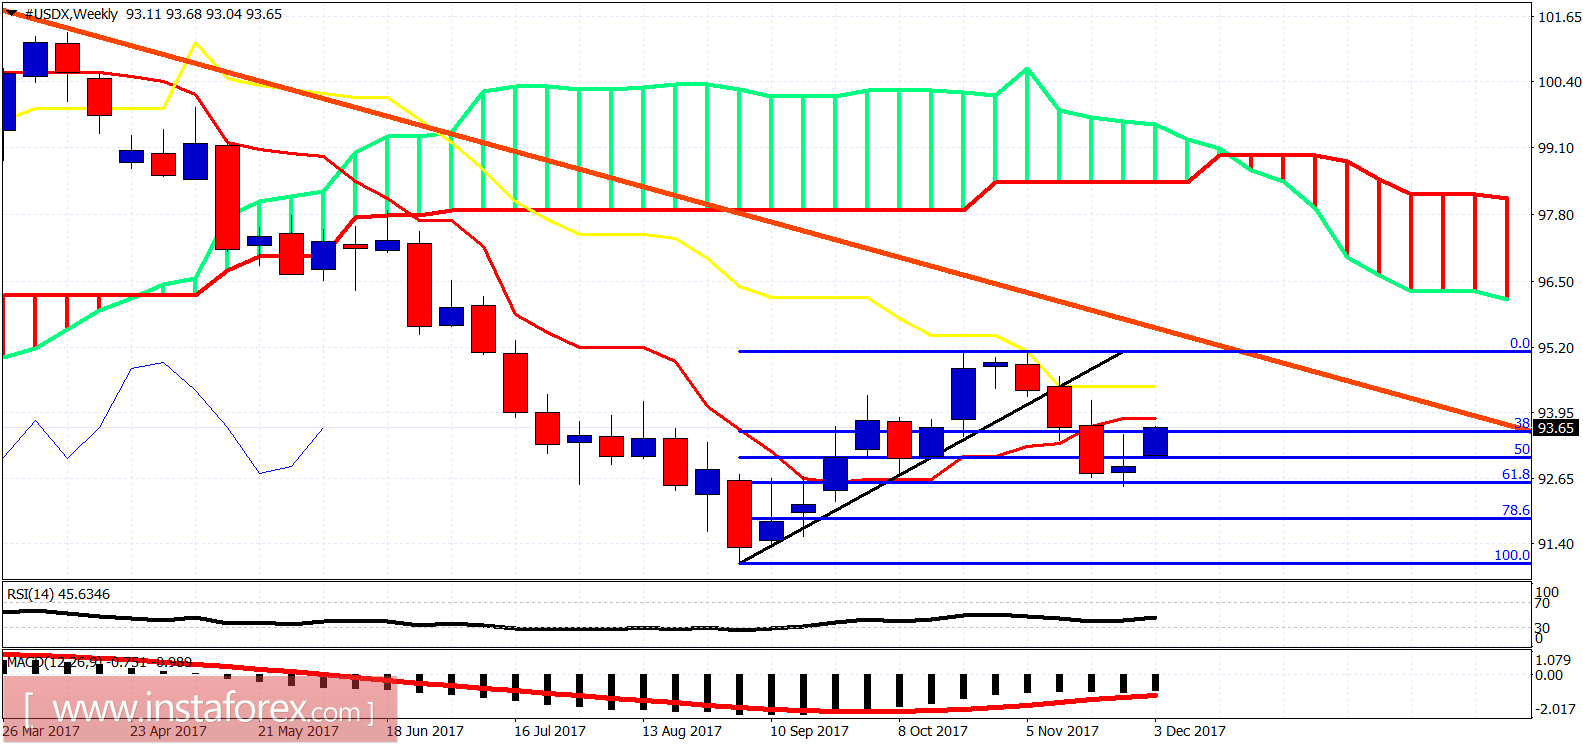
On a weekly basis, the US dollar index has started the bounce exactly as expected. Price is now approaching the Tenkan-sen resistance at 93.80-93.90. A weekly close above this level will be a bullish sign. Next important resistance is at 94.40. Weekly support that must hold now is at 93. A break below 93 will be a very bearish sign for the index.
*The market analysis posted here is meant to increase your awareness, but not to give instructions to make a trade
 English
  Русский
 Bahasa Indonesia
 Bahasa Malay
 ไทย
ไทย Español
 Deutsch
 Български
 Français
 Tiếng Việt
 中文
中文 বাংলা
বাংলা हिन्दी
 Čeština
 Українська
 Română
