 English
  Русский
 Bahasa Indonesia
 Bahasa Malay
 ไทย
ไทย Español
 Deutsch
 Български
 Français
 Tiếng Việt
 中文
中文 বাংলা
বাংলা हिन्दी
 Čeština
 Українська
 Română

The index has been rallying above the 200 SMA across the board and it's facing the resistance level of 94.00, which should act as a strong barrier for buyers. To the downside, the moving average needs to hold in order to allow further gains in USDX. However, if it breaks below that area, next target to face lies at 92.70.
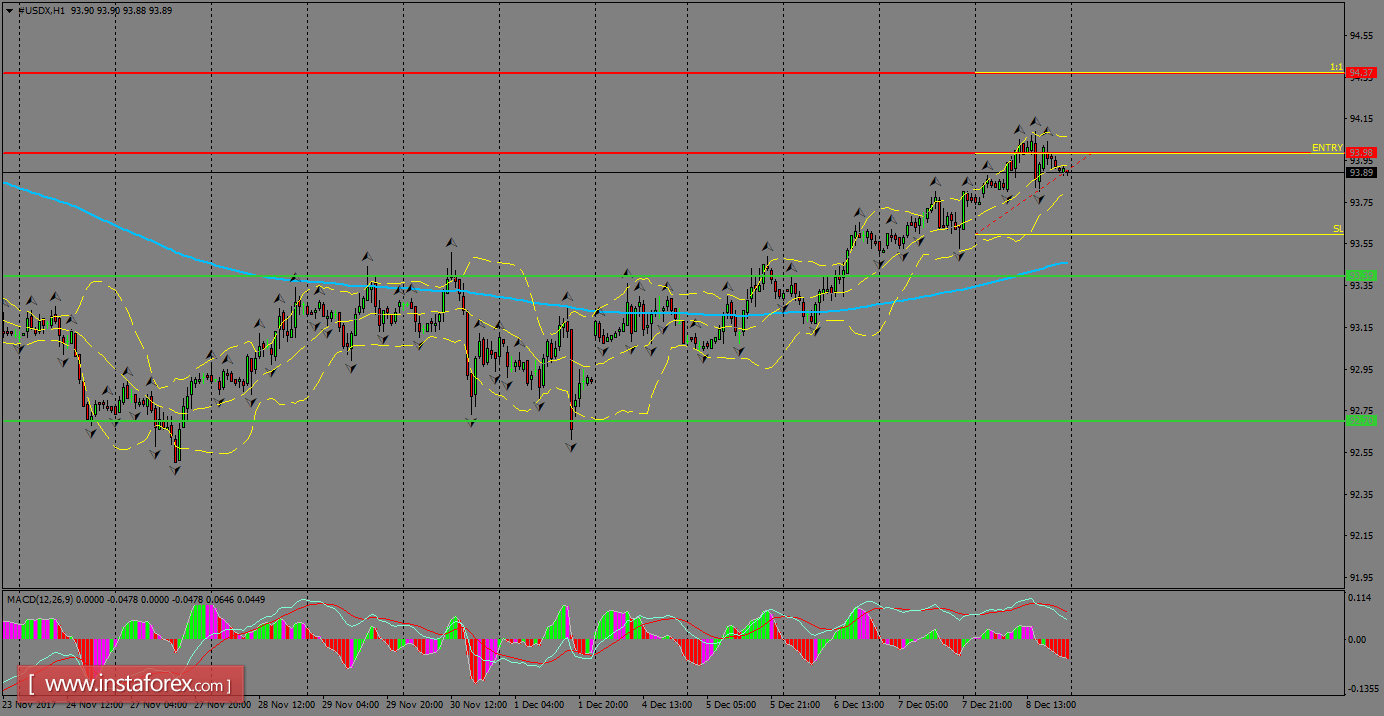
H1 chart's resistance levels: 94.00 / 94.37
H1 chart's support levels: 93.40 / 92.70
Trading recommendations for today: Based on the H1 chart, place buy (sell) orders only if the USD Index breaks with a bullish candlestick; the resistance level is at 94.00, take profit is at 94.37 and stop loss is at 93.73.