 English
  Русский
 Bahasa Indonesia
 Bahasa Malay
 ไทย
ไทย Español
 Deutsch
 Български
 Français
 Tiếng Việt
 中文
中文 বাংলা
বাংলা हिन्दी
 Čeština
 Українська
 Română

USDX is doing a retracement from the psychological level of 94.00 and it's expected to fall towards the 200 SMA, at which the index could gain some kind of momentum in order to ride the bullish trend. If that happens, the next critical level lies at 94.37. To the downside, if the index manages to break below 93.40, then it will be able to test the 92.70 level.
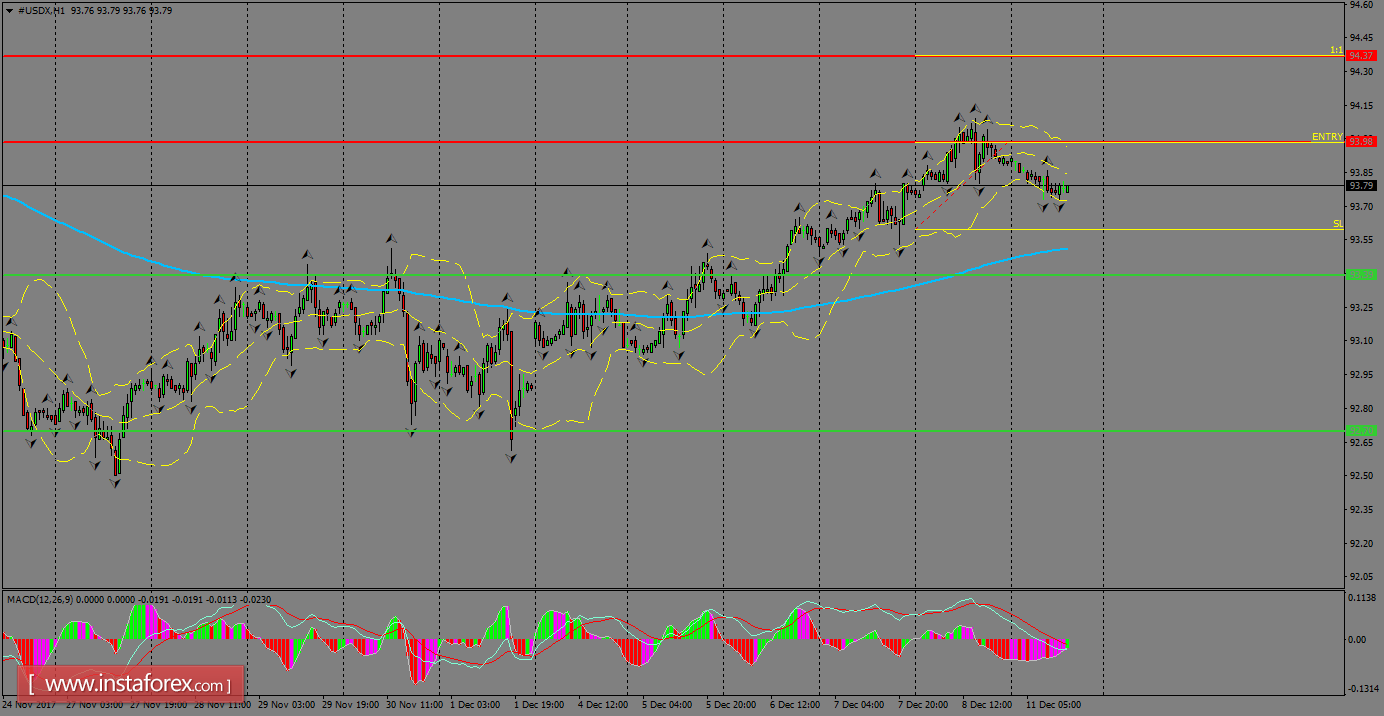
H1 chart's resistance levels: 94.00 / 94.37
H1 chart's support levels: 93.40 / 92.70
Trading recommendations for today: Based on the H1 chart, place buy (sell) orders only if the USD Index breaks with a bullish candlestick; the resistance level is at 94.00, take profit is at 94.37 and stop loss is at 93.73.