 English
  Русский
 Bahasa Indonesia
 Bahasa Malay
 ไทย
ไทย Español
 Deutsch
 Български
 Français
 Tiếng Việt
 中文
中文 বাংলা
বাংলা हिन्दी
 Čeština
 Українська
 Română

The index keeps its bullish structure untouched below the resistance level of 94.00. That level should give up in order to allow more gains toward the 94.37 level. To the downside, the 200 SMA at H1 chart provides a dynamic support and it should help to give a boost to USDX when it's being tested. MACD indicator remains in favor of the bears.
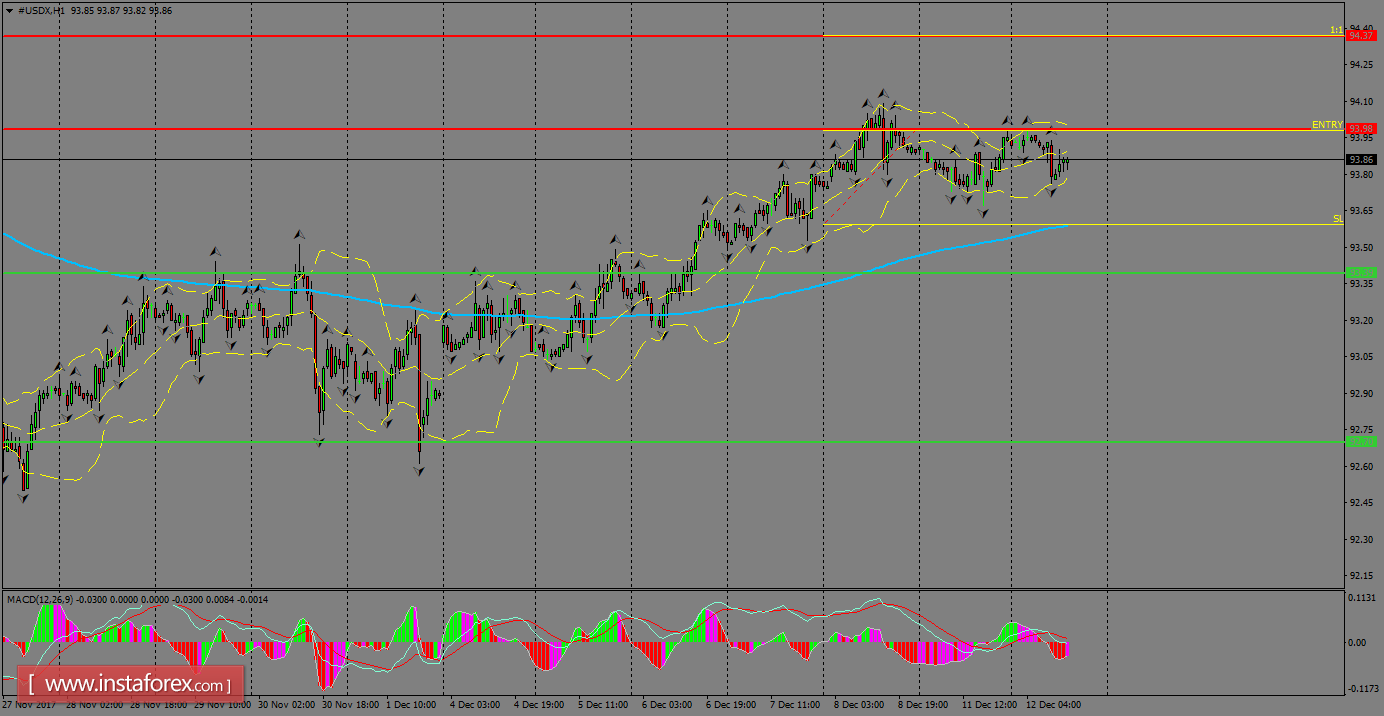
H1 chart's resistance levels: 94.00 / 94.37
H1 chart's support levels: 93.40 / 92.70
Trading recommendations for today: Based on the H1 chart, place buy (sell) orders only if the USD Index breaks with a bullish candlestick; the resistance level is at 94.00, take profit is at 94.37 and stop loss is at 93.73.