 English
  Русский
 Bahasa Indonesia
 Bahasa Malay
 ไทย
ไทย Español
 Deutsch
 Български
 Français
 Tiếng Việt
 中文
中文 বাংলা
বাংলা हिन्दी
 Čeština
 Українська
 Română

Gold price remains in a bearish trend but yesterday we observed the bullish divergence in the RSI together with a candlestick reversal pattern. Price has the potential to rise to $1,260 today.
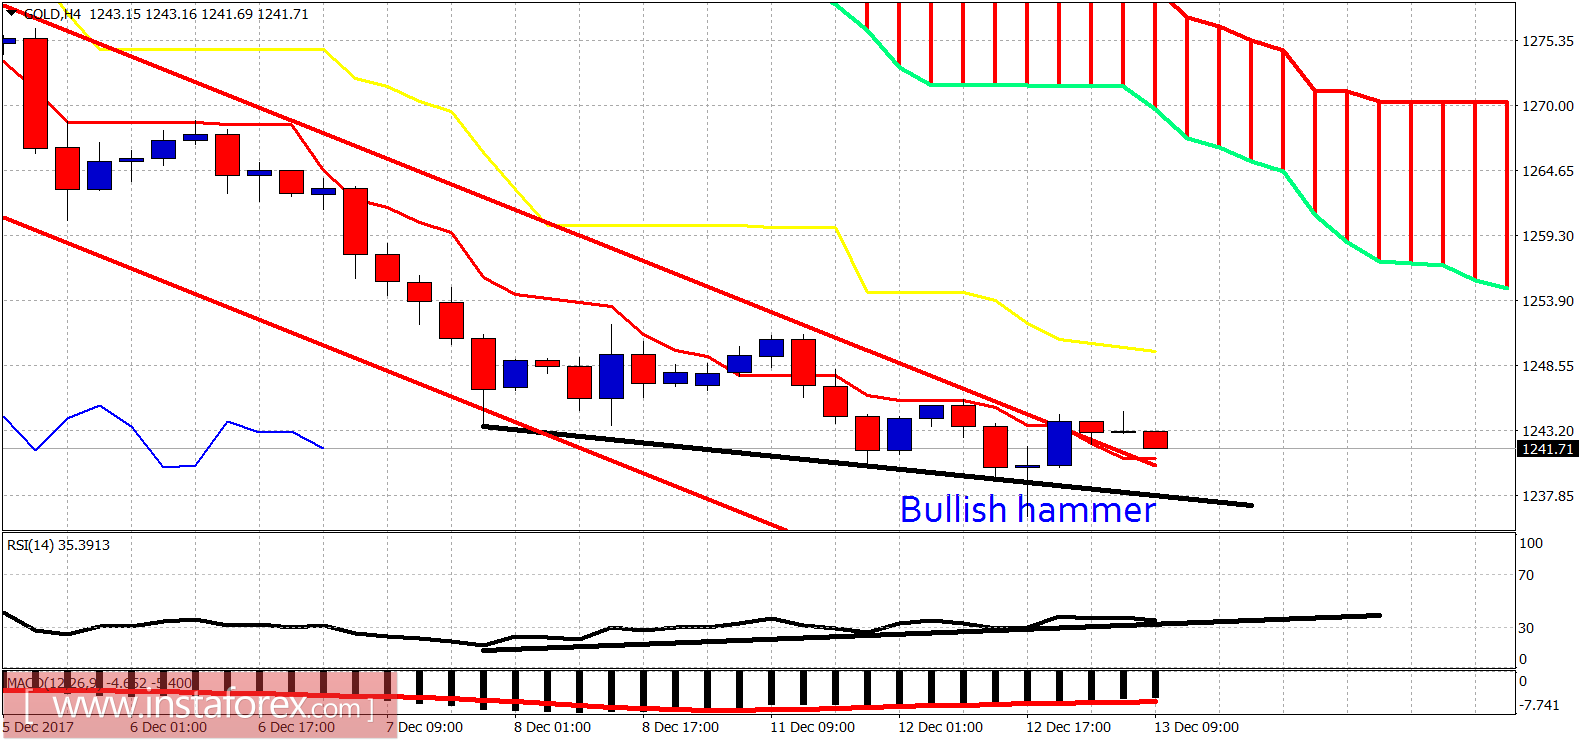
Black lines - bullish divergence
Gold price has broken out of the bearish channel and is now back testing it. The RSI is warning bears that the downside momentum has weakened. The 4-hour candle pattern of a bullish hammer is usually a trustworthy reversal pattern. Resistance is at $1,247. Breaking above it will confirm the reversal pattern and push price towards cloud resistance at $1,255-60.
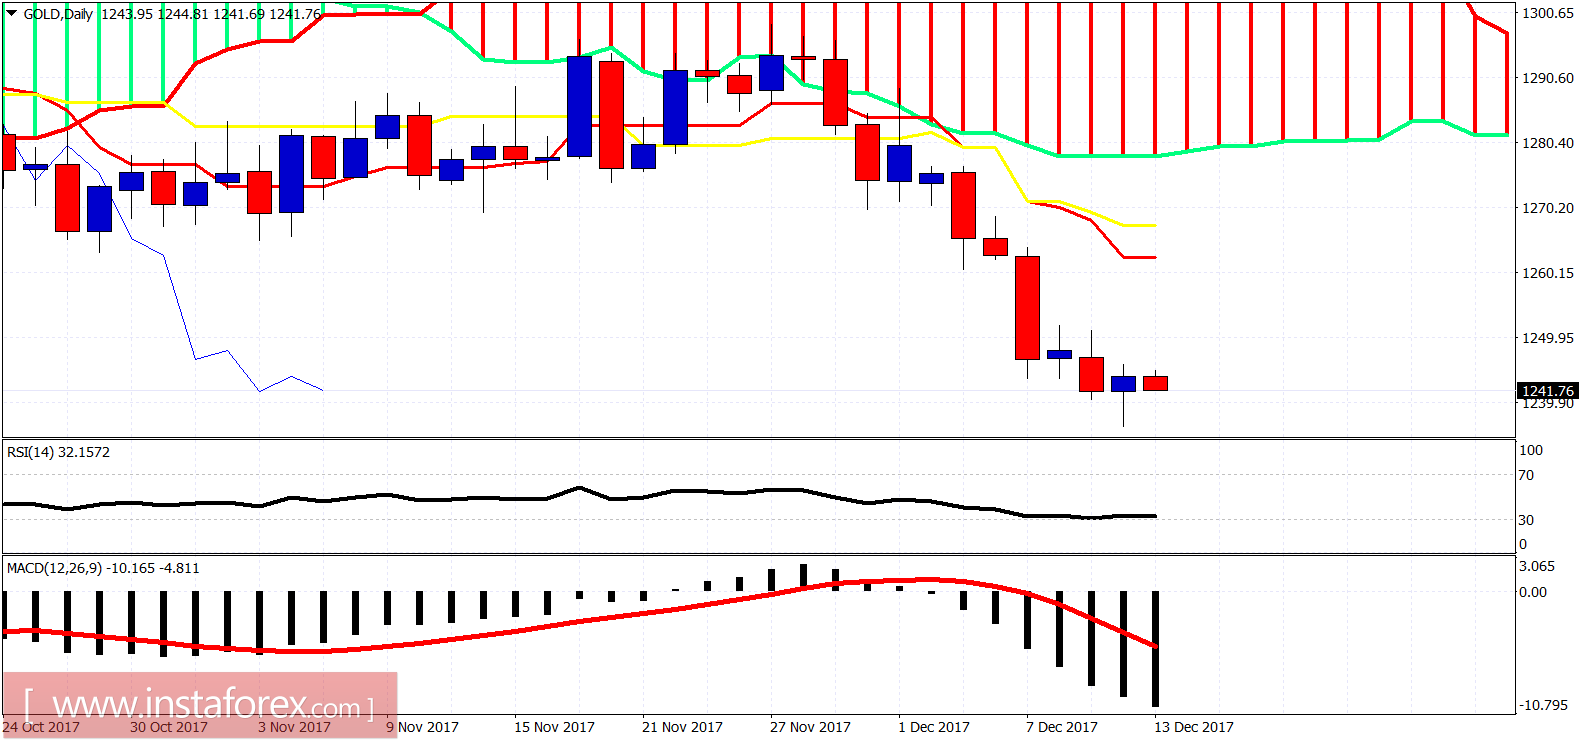
On a daily basis Gold price has also made a bullish hammer. With FOMC tonight we expect Gold price to be volatile. If price is near $1,260 before the FOMC, I would prefer to be neutral as we might see another leg down towards $1,220-$1,200.