English
  Русский
 Bahasa Indonesia
 Bahasa Malay
 ไทย
ไทย Español
 Deutsch
 Български
 Français
 Tiếng Việt
 中文
中文 বাংলা
বাংলা हिन्दी
 Čeština
 Українська
 Română

The Dollar index is making new highs. Market participants discount a rate hike and more positive news regarding the Dollar before tonight's FOMC. However traders must be cautious as price is rising in an upward sloping wedge pattern.
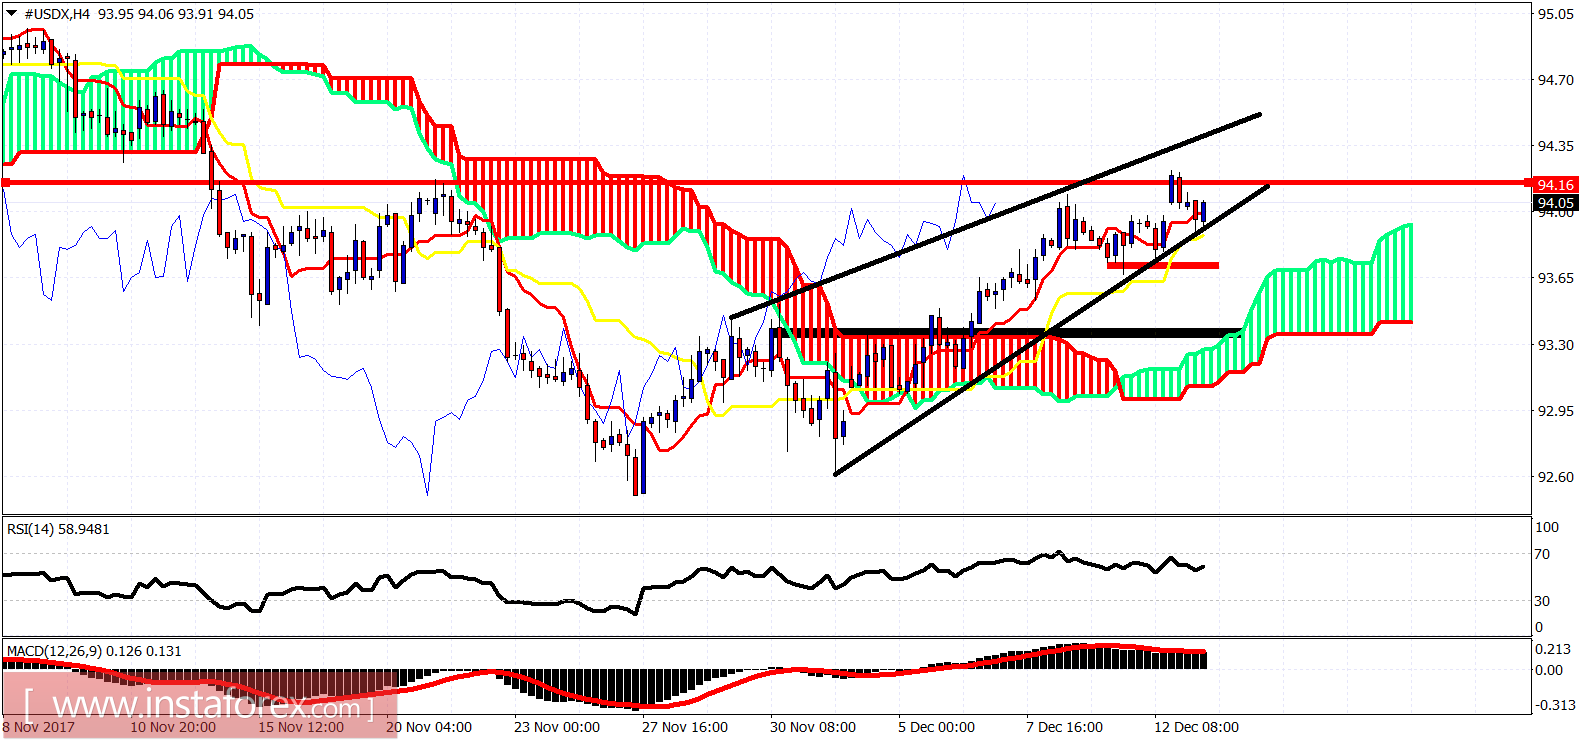
Red rectangle - support
Black line - target if support fails.
The Dollar index is in a bullish trend. Price is making higher highs and higher lows. Support is at 93.70-93.80. If this level is broken, I expect price to fall towards the cloud support and the 93.30 level.