 English
  Русский
 Bahasa Indonesia
 Bahasa Malay
 ไทย
ไทย Español
 Deutsch
 Български
 Français
 Tiếng Việt
 中文
中文 বাংলা
বাংলা हिन्दी
 Čeština
 Українська
 Română

USDX managed to recover above the 200 SMA at H1 chart and looks forward to reaching the next resistance zone lying at 94.09. If the index does a break over there, the next hurdle is located at 94.85. To the downside, if the index makes a pullback to resume the bearish bias held since December 12th session, then the next target could be the 93.29 level.
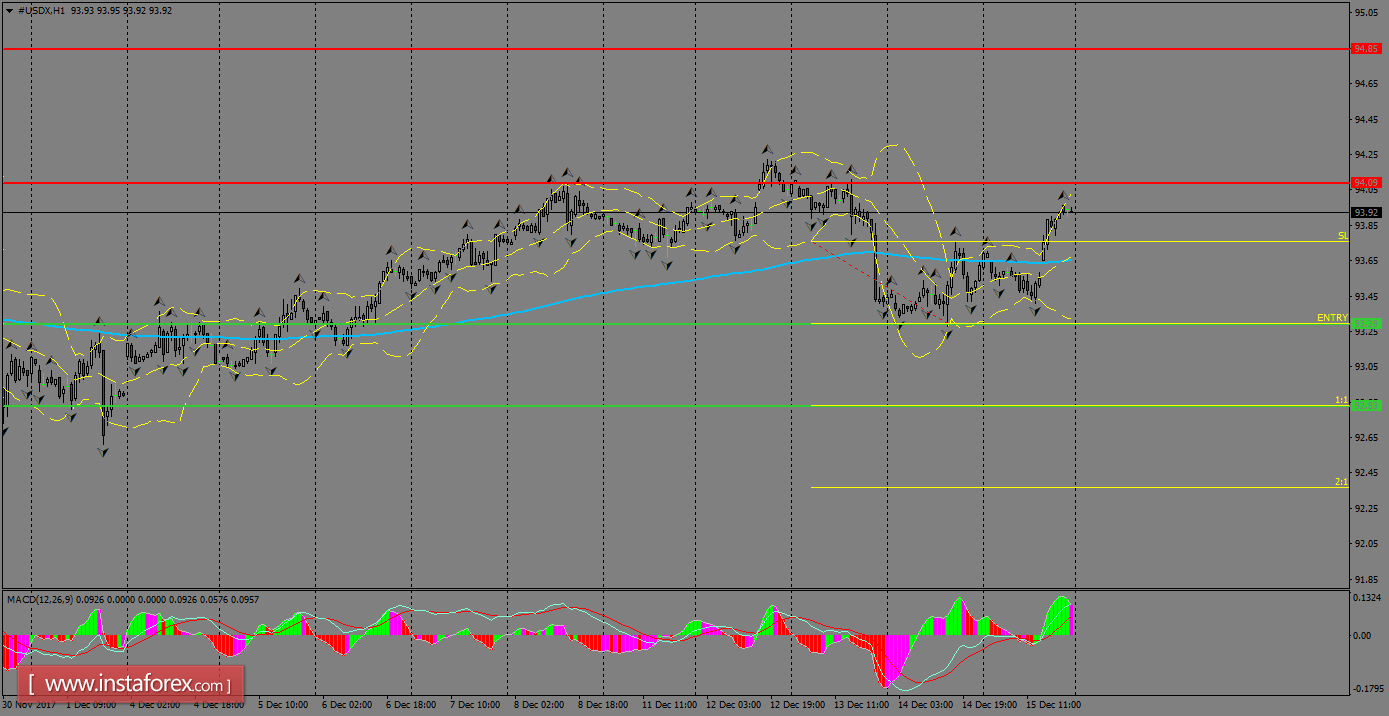
H1 chart's resistance levels: 94.09 / 94.85
H1 chart's support levels: 93.30 / 92.83
Trading recommendations for today: Based on the H1 chart, place sell (short) orders only if the USD Index breaks with a bearish candlestick; the support level is at 93.30, take profit is at 92.83 and stop loss is at 93.76.