 English
  Русский
 Bahasa Indonesia
 Bahasa Malay
 ไทย
ไทย Español
 Deutsch
 Български
 Français
 Tiếng Việt
 中文
中文 বাংলা
বাংলা हिन्दी
 Čeština
 Українська
 Română

USDX still trades in a sideways range and remains capped by the resistance level of 94.09. The risk to the downside is high and once the level of 93.30 gives up, we will be expecting a leg lower to test the support zone of 92.83. The MACD indicator supports the bearish bias in the short-term, as it remains in the negative territory.
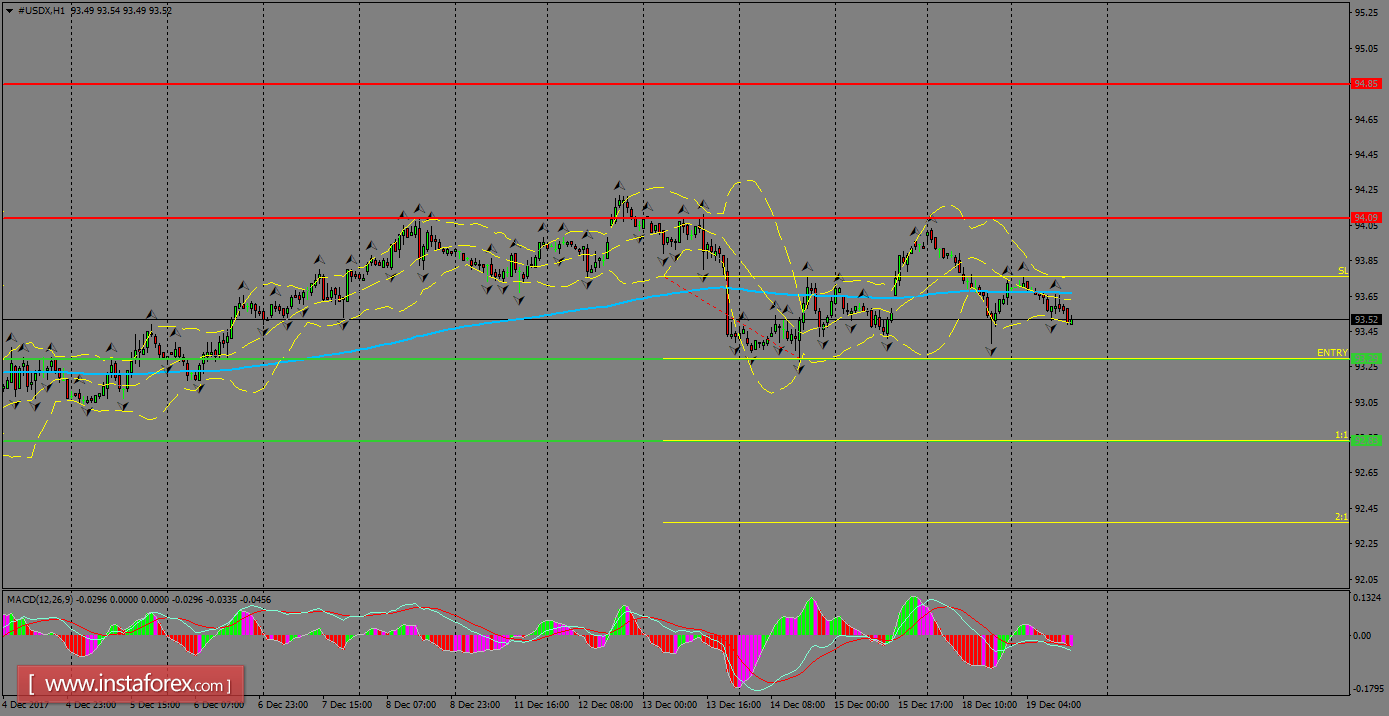
H1 chart's resistance levels: 94.09 / 94.85
H1 chart's support levels: 93.30 / 92.83
Trading recommendations for today: Based on the H1 chart, place sell (short) orders only if the USD Index breaks with a bearish candlestick; the support level is at 93.30, take profit is at 92.83 and stop loss is at 93.76.