English
  Русский
 Bahasa Indonesia
 Bahasa Malay
 ไทย
ไทย Español
 Deutsch
 Български
 Français
 Tiếng Việt
 中文
中文 বাংলা
বাংলা हिन्दी
 Čeština
 Українська
 Română

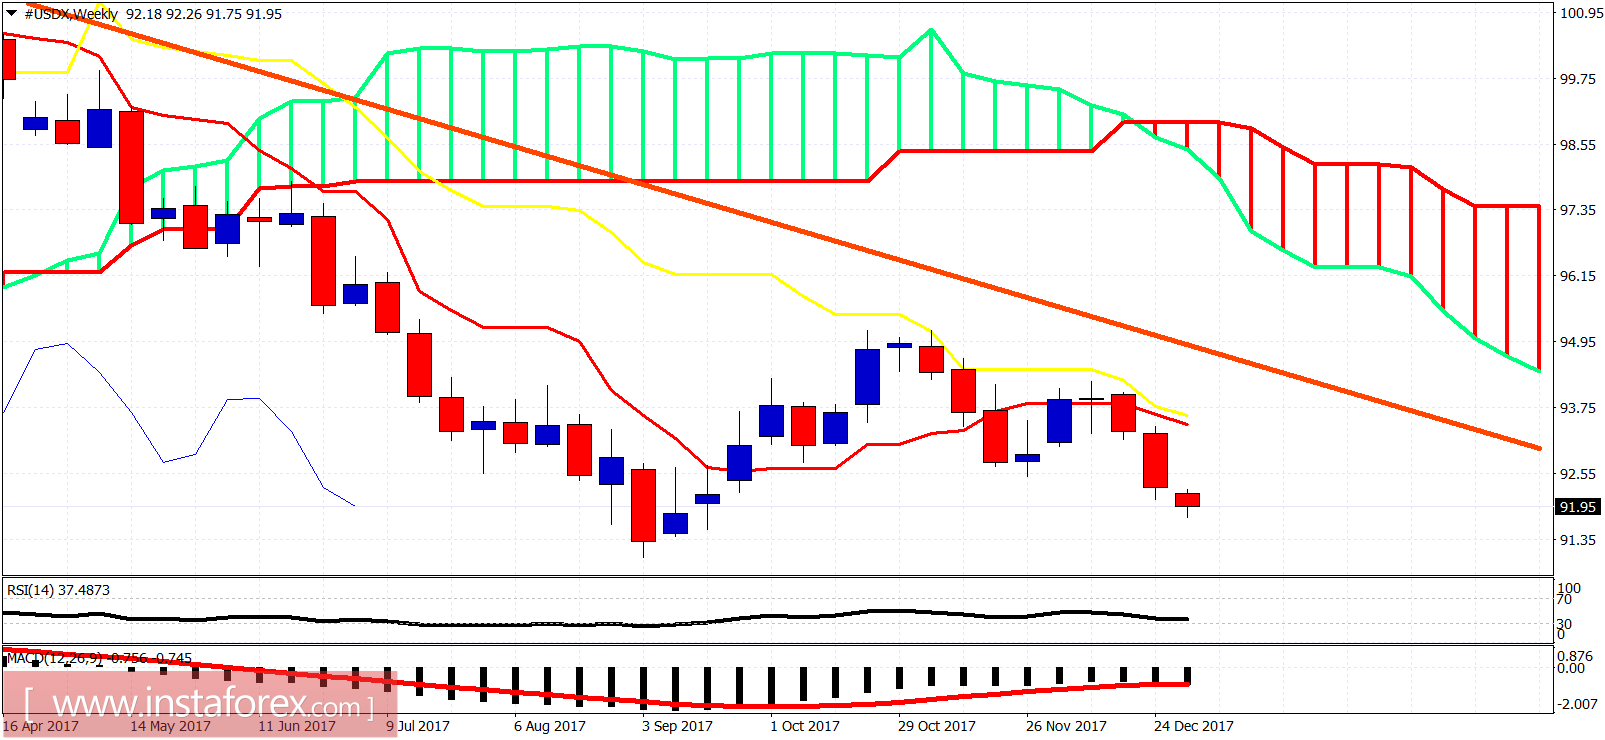
The US dollar index is showing reversal signs after retesting the recent low at 91.75 and the forming a double bottom pattern. As long as we are above 91.75, we could see a bounce towards the 92.70-92.50 area.
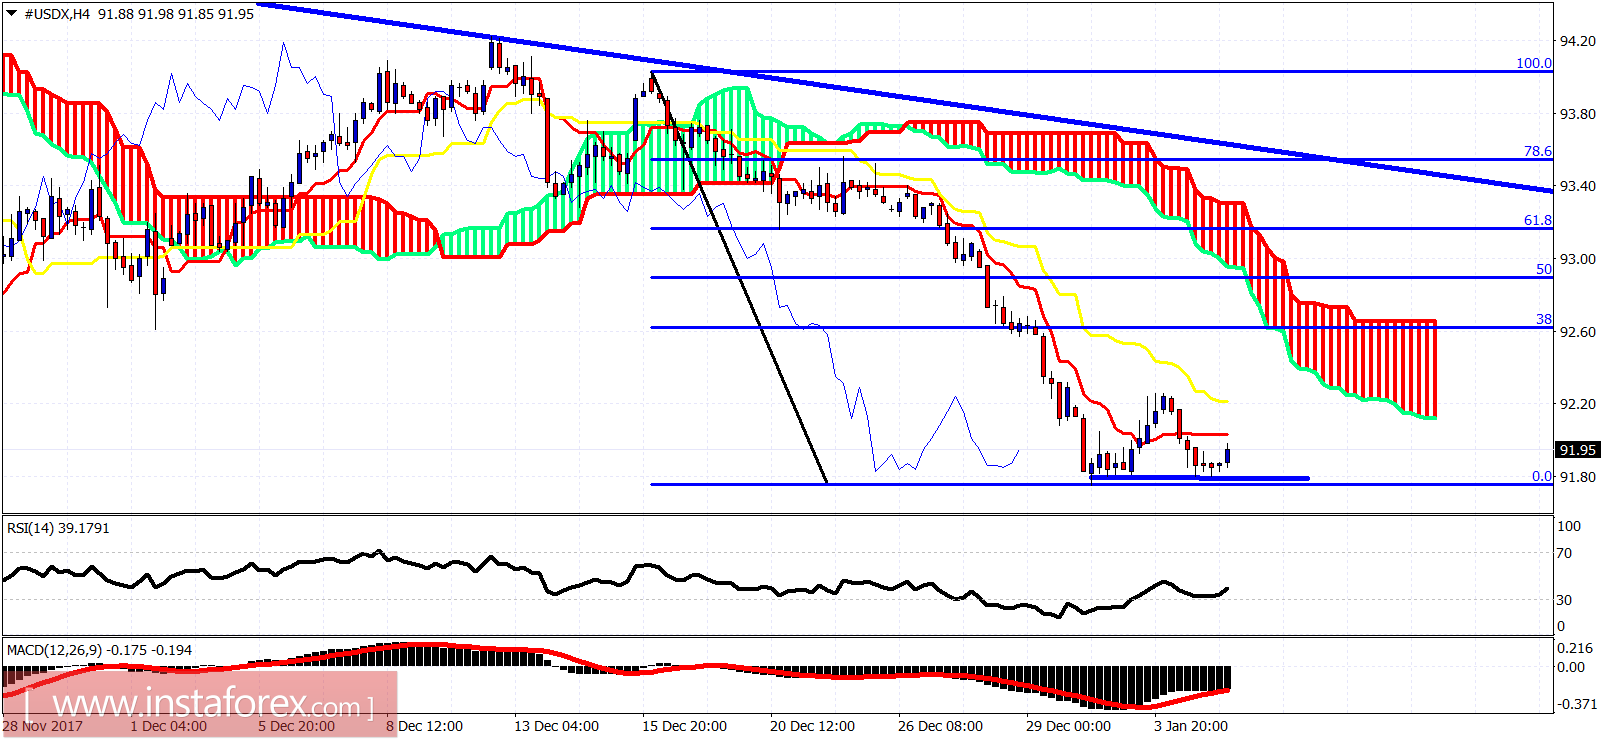
Downward sloping blue line - resistance
The US dollar index is expected to bounce at least towards the 38% Fibonacci retracement near the Ichimoku cloud at 92.60 over the coming days. The double bottom formation, as long as it is not broken downwards, should give the dollar a push higher.