 English
  Русский
 Bahasa Indonesia
 Bahasa Malay
 ไทย
ไทย Español
 Deutsch
 Български
 Français
 Tiếng Việt
 中文
中文 বাংলা
বাংলা हिन्दी
 Čeština
 Українська
 Română

Gold price is consolidating and moving sideways in the short-term. Price has formed a triangle pattern. Triangles are usually found at the last stages of a trend, so we could see a final break out towards $1,330-40 before the reversal.
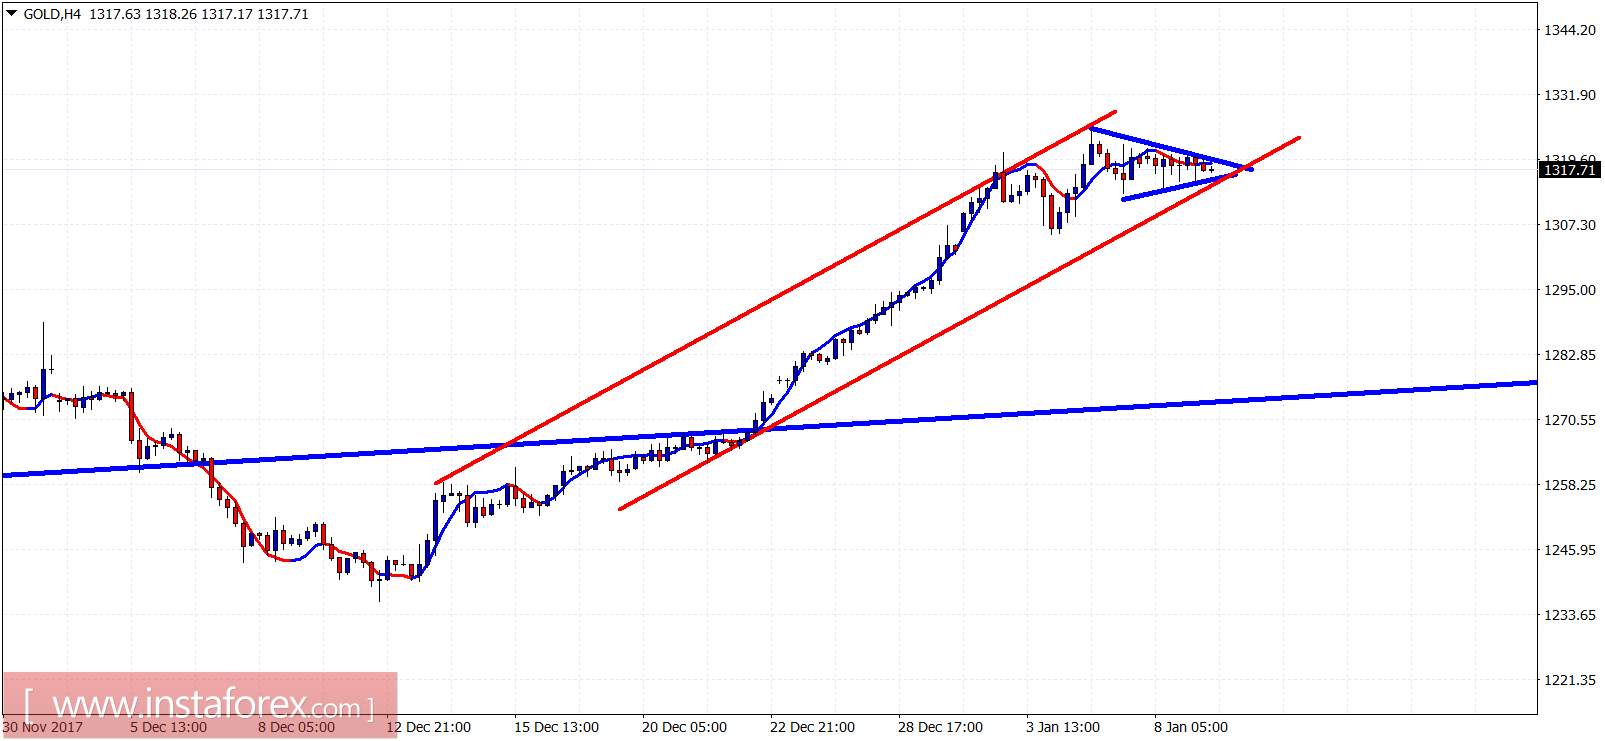
Blue lines - triangle pattern
Gold price remains inside the bullish channel while moving sideways in a triangle pattern. Support is at $1,316 and resistance lies at $1,322. A break above resistance could push the price to $1,330. A break below support will signal the start of the correction phase of at least the upward move from December lows.
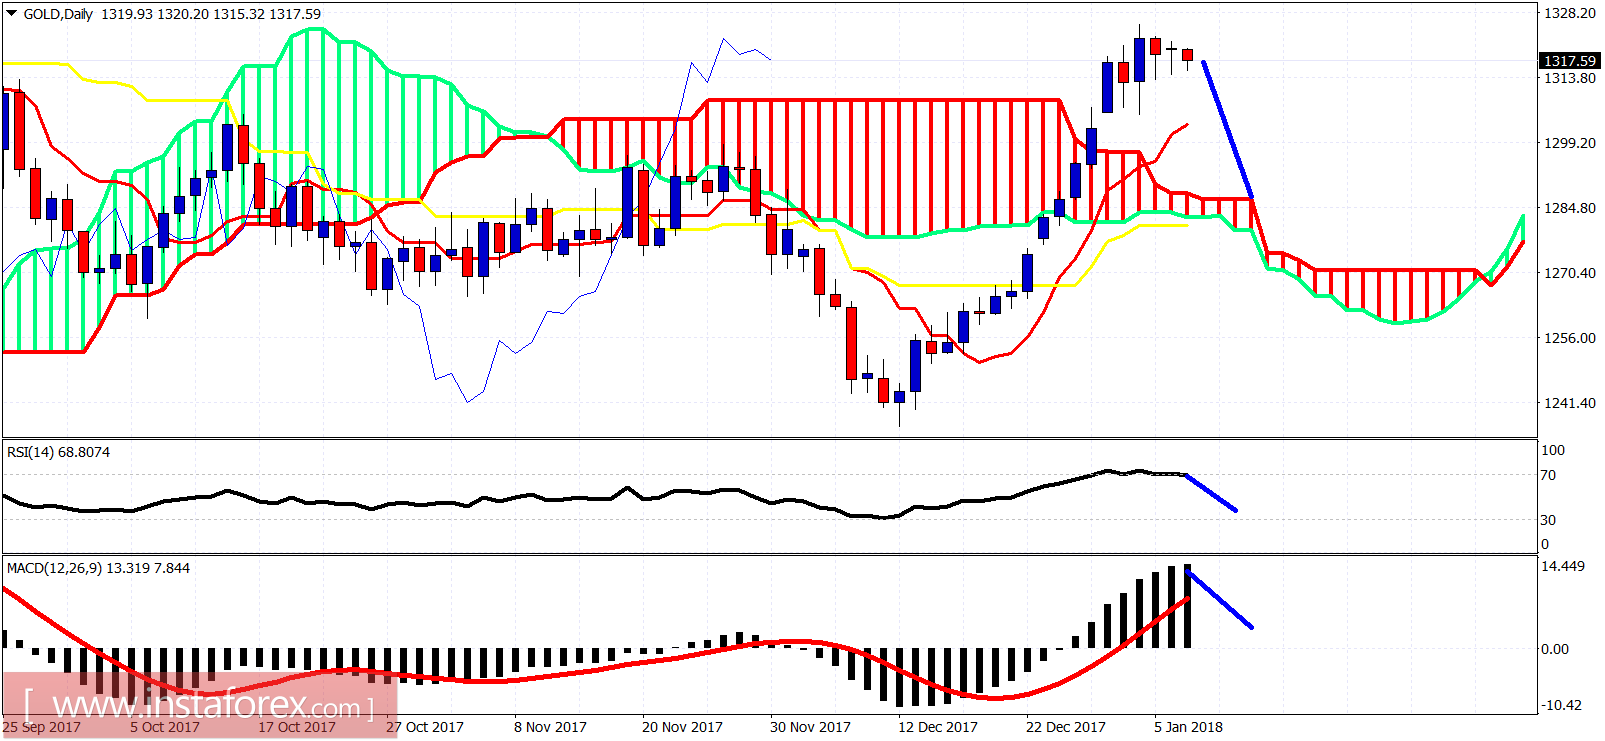
Gold price has broken out of the Ichimoku cloud. The trend is bearish. But it is time for at least a pull back towards cloud support at $1,280. This is not the time be long on gold but look for bearish reversal confirmation.