 English
  Русский
 Bahasa Indonesia
 Bahasa Malay
 ไทย
ไทย Español
 Deutsch
 Български
 Français
 Tiếng Việt
 中文
中文 বাংলা
বাংলা हिन्दी
 Čeština
 Українська
 Română

The Dollar index is moving higher as expected. The trend is bearish as long as the price is below 93.65 but at least a short-term bounce towards 92.60 was expected and mentioned in our previous analysis. I believe we are heading towards that level of resistance and we could see it this week if not today.
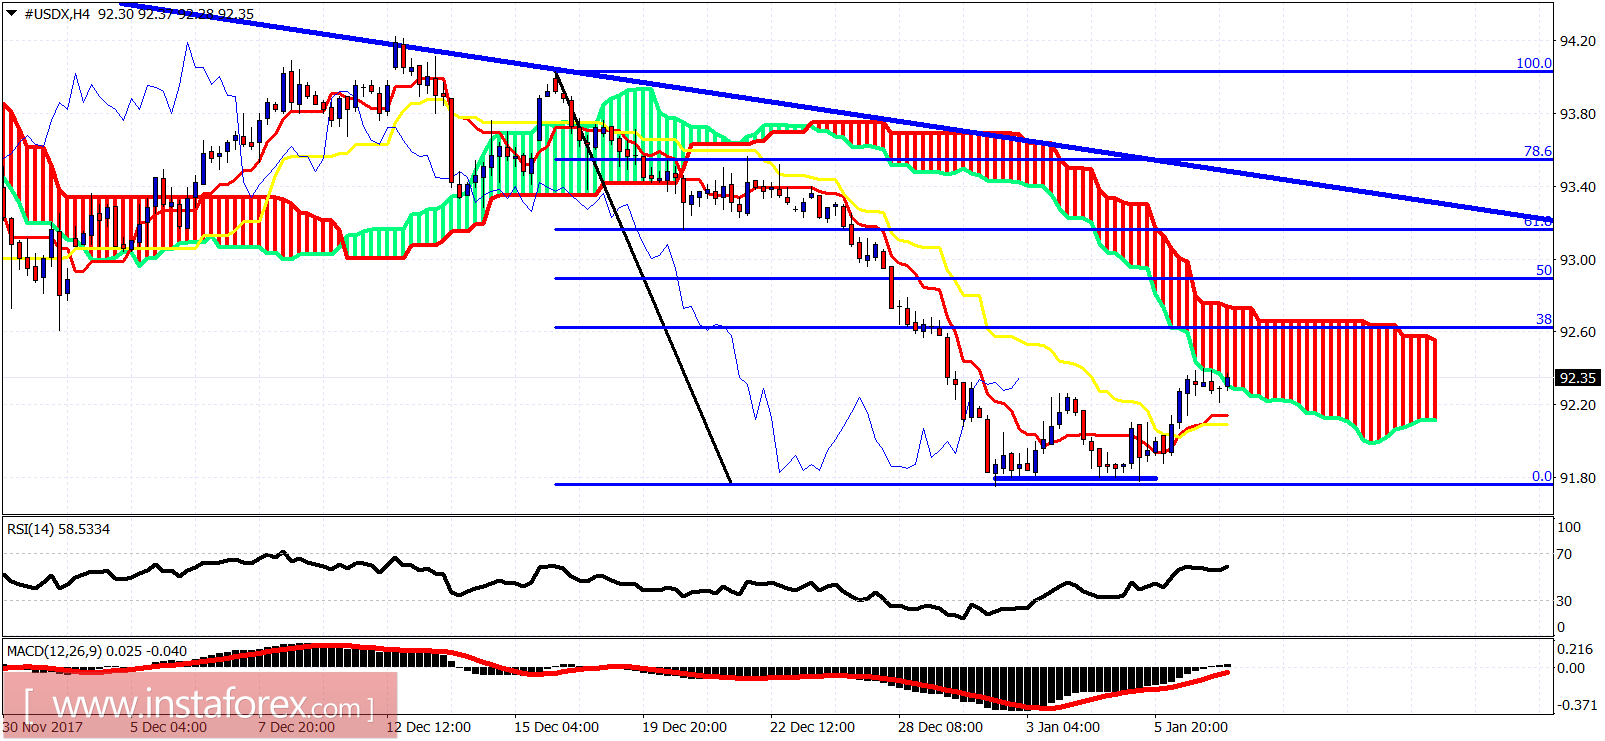
Blue lines - bearish channel
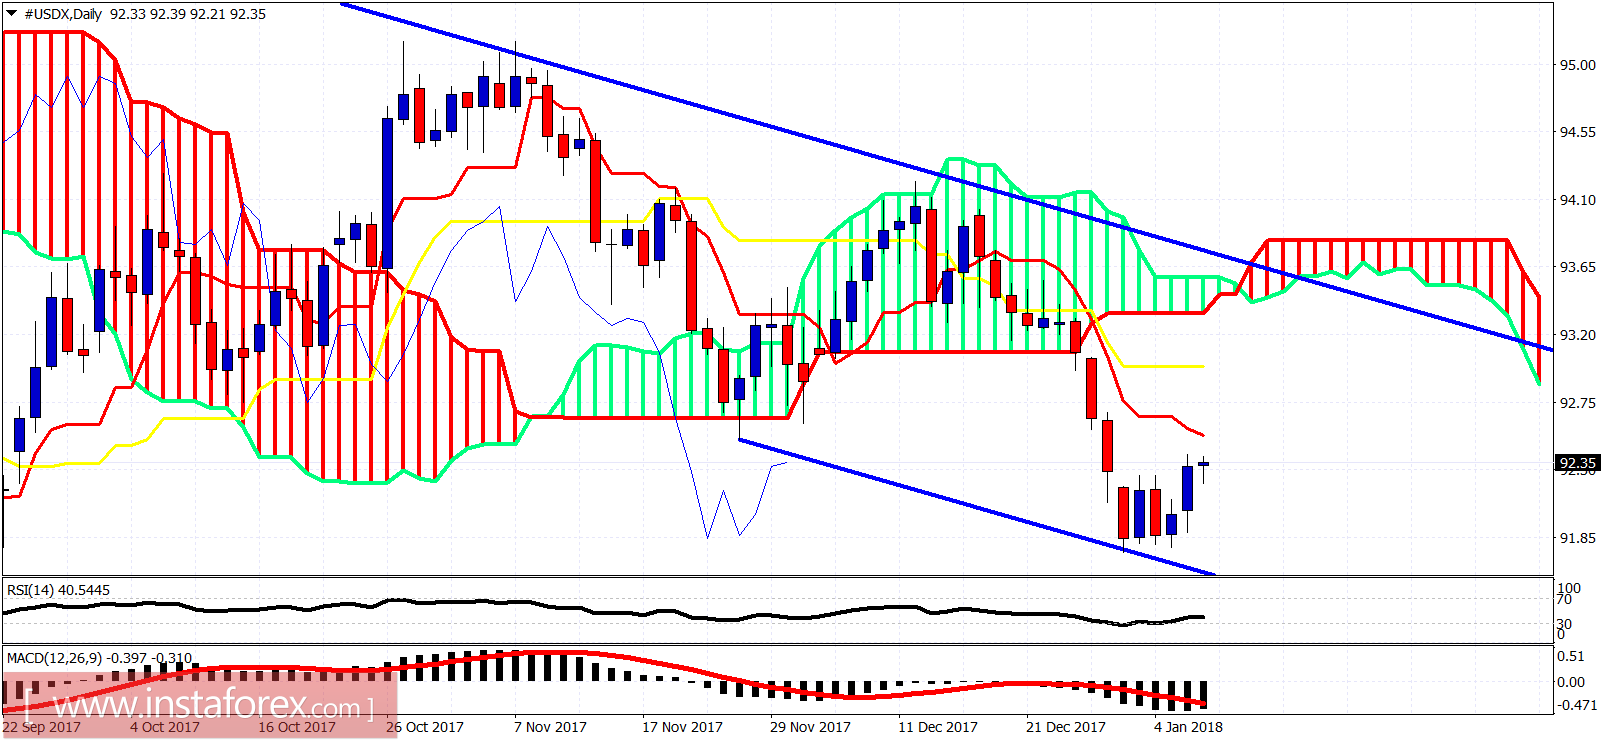
The Daily chart shows how the price is trying to make a bounce. The trend remains bearish as the price is still inside the bearish channel and below the Daily cloud. Daily resistance is at 93.50. Support is at 91.70. I expect the bounce to continue and even challenge the upper channel boundary. A break below 92 will be a bearish sign that will decrease dramatically the chances of a move towards 93.