 English
  Русский
 Bahasa Indonesia
 Bahasa Malay
 ไทย
ไทย Español
 Deutsch
 Български
 Français
 Tiếng Việt
 中文
中文 বাংলা
বাংলা हिन्दी
 Čeština
 Українська
 Română

Gold price has broken the triangle pattern we mentioned yesterday to the downside. As long as price is below $1,322 I expect Gold to move towards $1,290-80 at first. Gold short-term trend is changing to bearish. As said before, Gold is in a similar place when it was trading at $1,237 but from the bearish point of view.
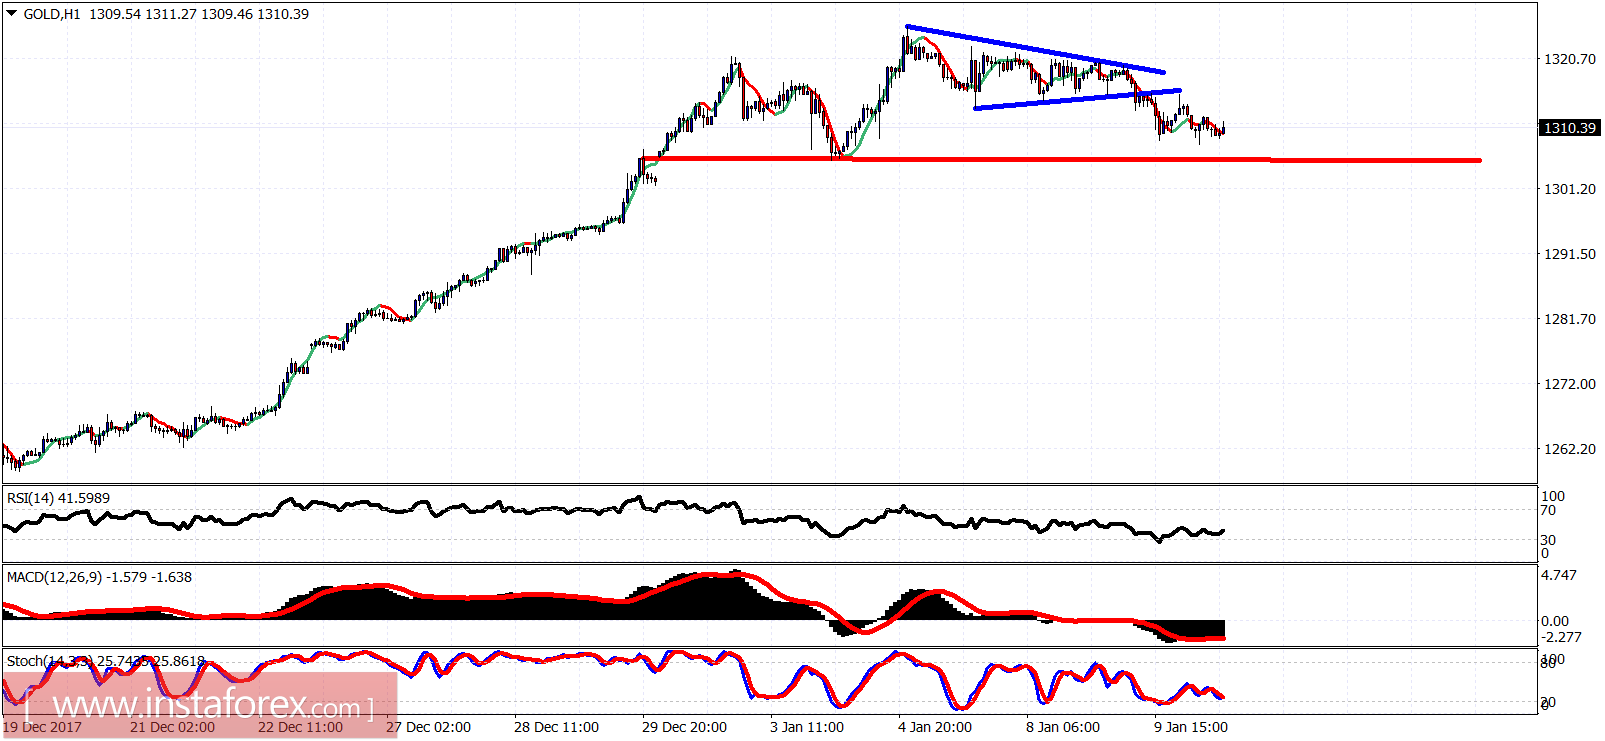
Red line - support
Gold price is near its highs but price has taken a downward turn. Price is making lower lows and lower highs in the 4-hour chart. The bearish divergence signs are finally proving themselves. Critical support is at $1,305. Breaking below that level will confirm our bearish view and accelerate the move lower.
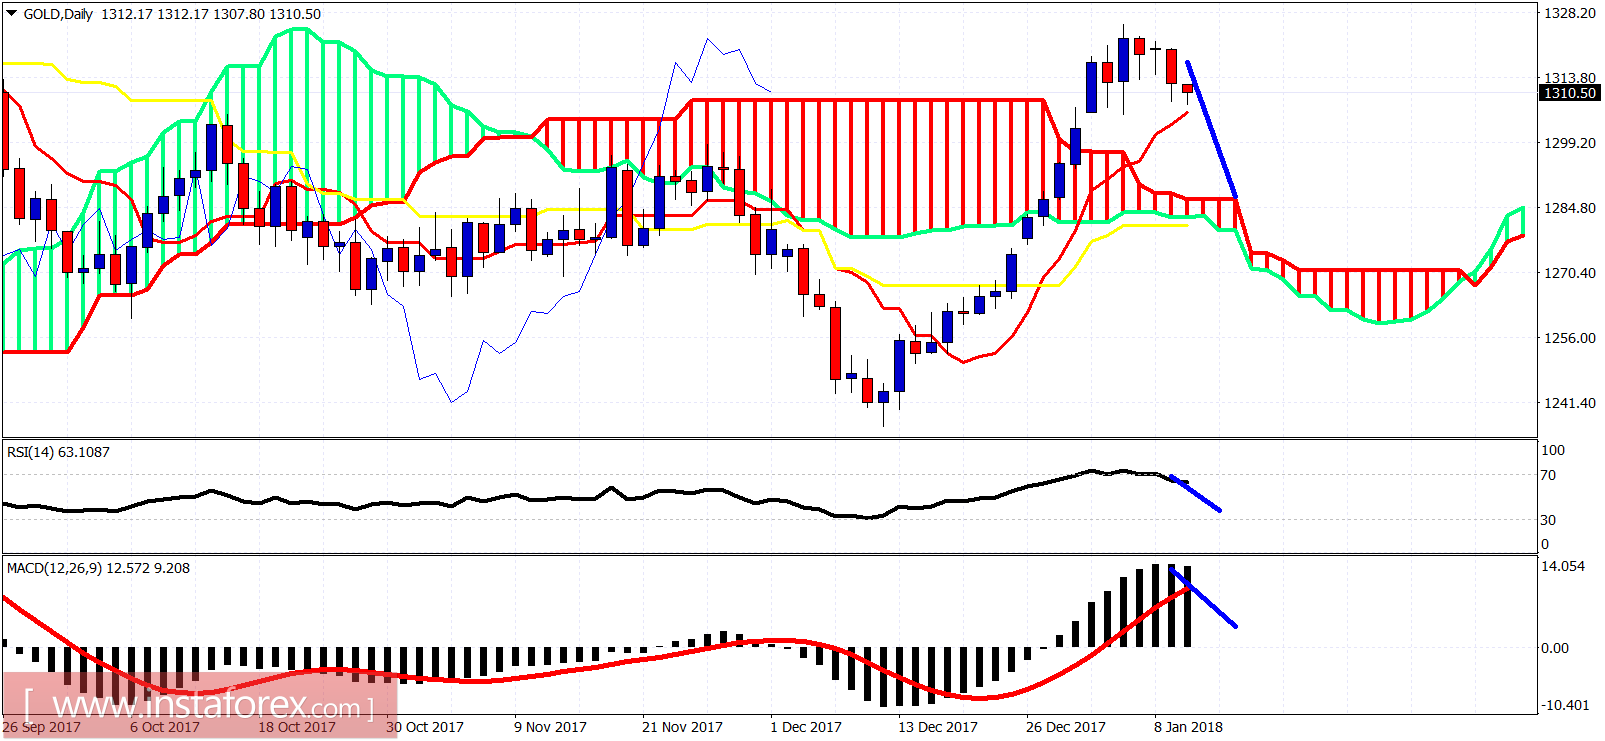
Gold price has broken out of the Daily cloud resistance and now I expect at least a back test of the broken cloud resistance back towards $1,285 at least. I'm bearish about Gold.