 English
  Русский
 Bahasa Indonesia
 Bahasa Malay
 ไทย
ไทย Español
 Deutsch
 Български
 Français
 Tiếng Việt
 中文
中文 বাংলা
বাংলা हिन्दी
 Čeština
 Українська
 Română

The index managed to make a pullback at the 200 SMA, according to the H1 chart, following a series of fractals formed across the board. USDX is now looking to test January 3rd lows in an effort to strengthen the bears for the short-term. If the index manages to break above the resistance level of 92.57, it's expected to rise towards the psychological level of 93.00.
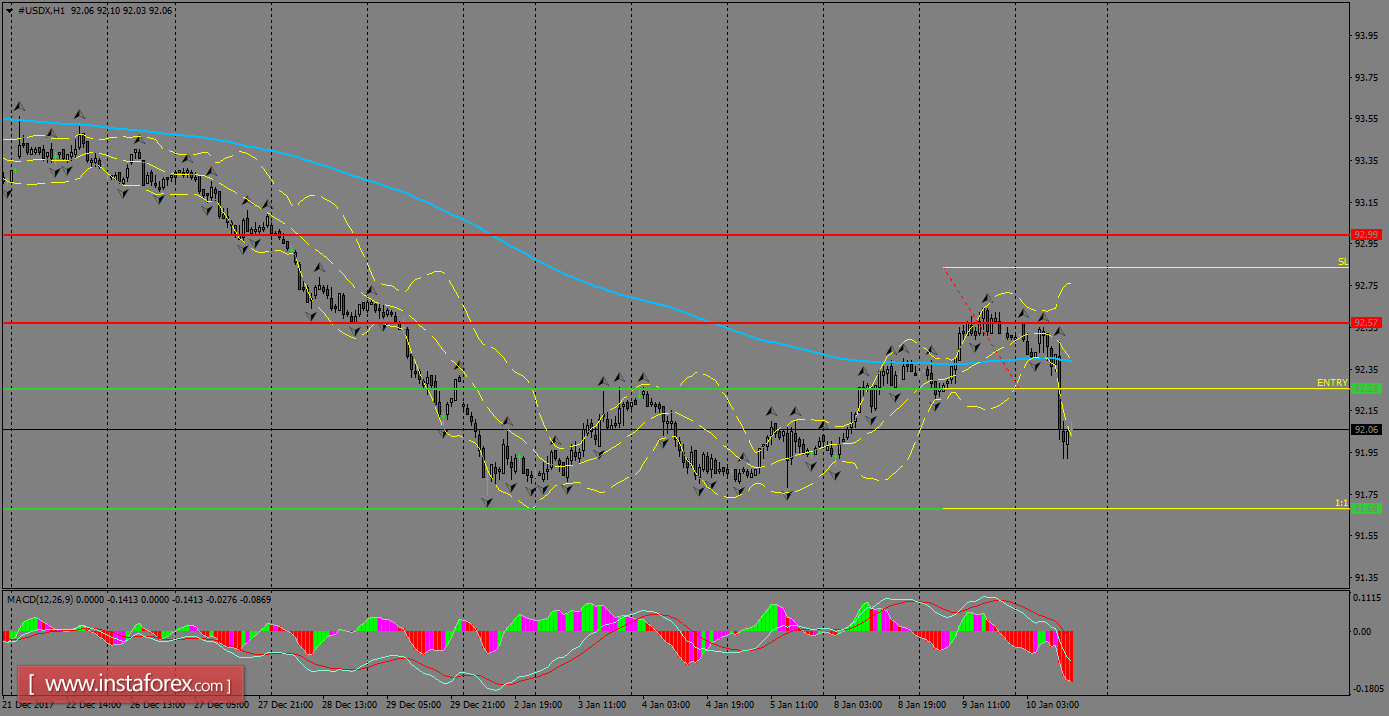
H1 chart's resistance levels: 92.57 / 93.00
H1 chart's support levels: 92.25 / 91.68
Trading recommendations for today: Based on the H1 chart, place sell (short) orders only if the USD Index breaks with a bearish candlestick; the support level is at 92.25, take profit is at 91.68 and stop loss is at 92.83.