 English
  Русский
 Bahasa Indonesia
 Bahasa Malay
 ไทย
ไทย Español
 Deutsch
 Български
 Français
 Tiếng Việt
 中文
中文 বাংলা
বাংলা हिन्दी
 Čeština
 Українська
 Română

The pair is consolidating the price action below the 200 SMA after having found a strong resistance at the 1.3589 level. So far, the next target to reach should be the support zone of 1.3451, at which a breakout should expose the December 26th lows. However, if GBP/USD manages to rebound at the current stage, then it can reach the 1.3589 level.
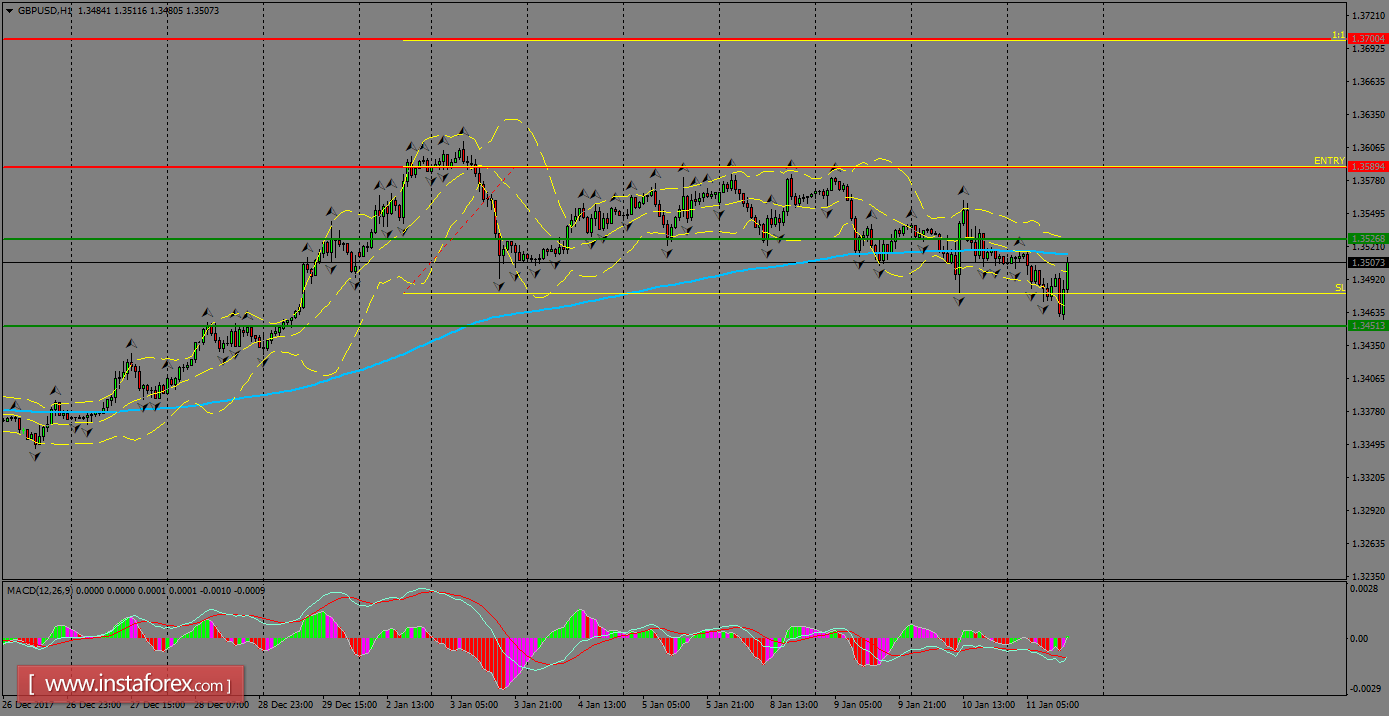
H1 chart's resistance levels: 1.3589 / 1.3700
H1 chart's support levels: 1.3526 / 1.3451
Trading recommendations for today: Based on the H1 chart, buy (long) orders only if the GBP/USD pair breaks a bullish candlestick; the resistance level is at 1.3589, take profit is at 1.3700 and stop loss is at 1.3480.