 English
  Русский
 Bahasa Indonesia
 Bahasa Malay
 ไทย
ไทย Español
 Deutsch
 Български
 Français
 Tiếng Việt
 中文
中文 বাংলা
বাংলা हिन्दी
 Čeština
 Українська
 Română

USDX continues to develop some fractals above yesterday's lows, waiting to reach the 200 SMA at the H1 chart. The index should hold those lows in order to test the moving average mentioned above, but the risk to the downside is still high. If the index consolidates below the 90.59 level, the next target would be the 89.36 zone.
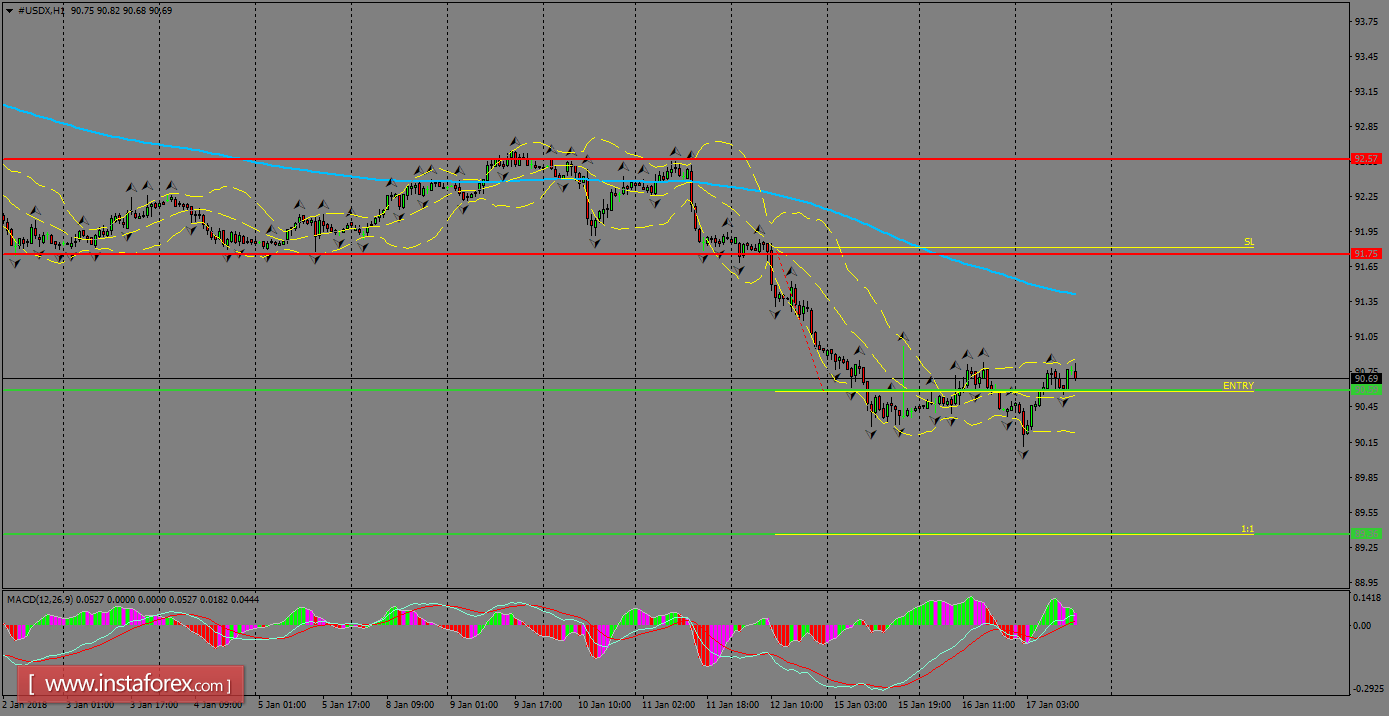
H1 chart's resistance levels: 91.75 / 92.57
H1 chart's support levels: 90.59 / 89.36
Trading recommendations for today: Based on the H1 chart, place sell (short) orders only if the USD Index breaks with a bearish candlestick; the support level is at 90.59, take profit is at 89.36 and stop loss is at 91.81.