 English
  Русский
 Bahasa Indonesia
 Bahasa Malay
 ไทย
ไทย Español
 Deutsch
 Български
 Français
 Tiếng Việt
 中文
中文 বাংলা
বাংলা हिन्दी
 Čeština
 Українська
 Română

The Gold price is making lower lows but Ichimoku cloud trend remains bullish as price remains above the 4hour cloud. Key technical and cloud support remains at $1,309 and as long as we are above it, the trend remains bullish.
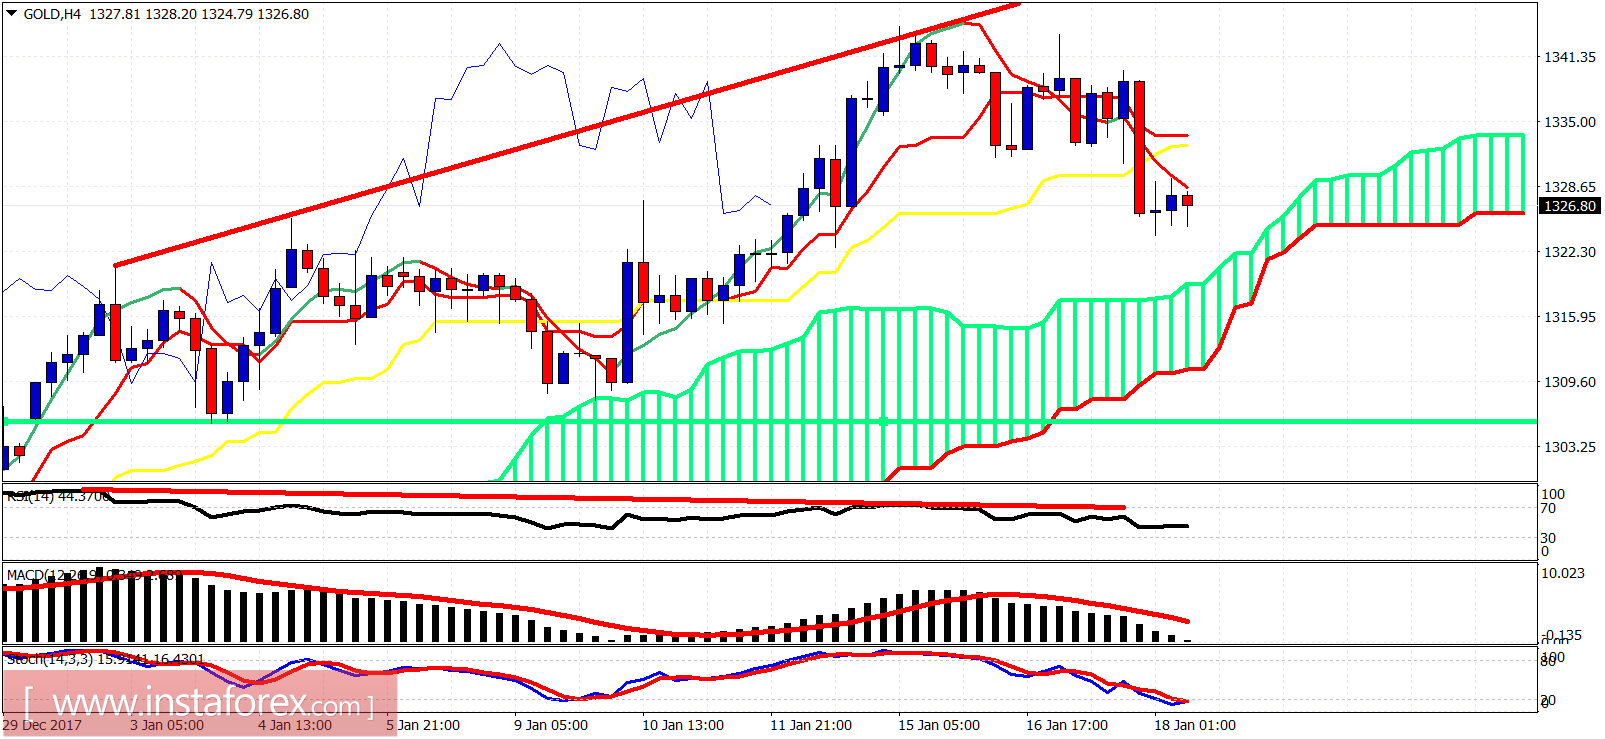
Green line - support trend line
Short-term support is at $1,319 at the upper cloud boundary. Short-term resistance is at $1,333 where we find the tenkan- and kijun-sen. Price has broken below the two indicators and this is a first warning sign.
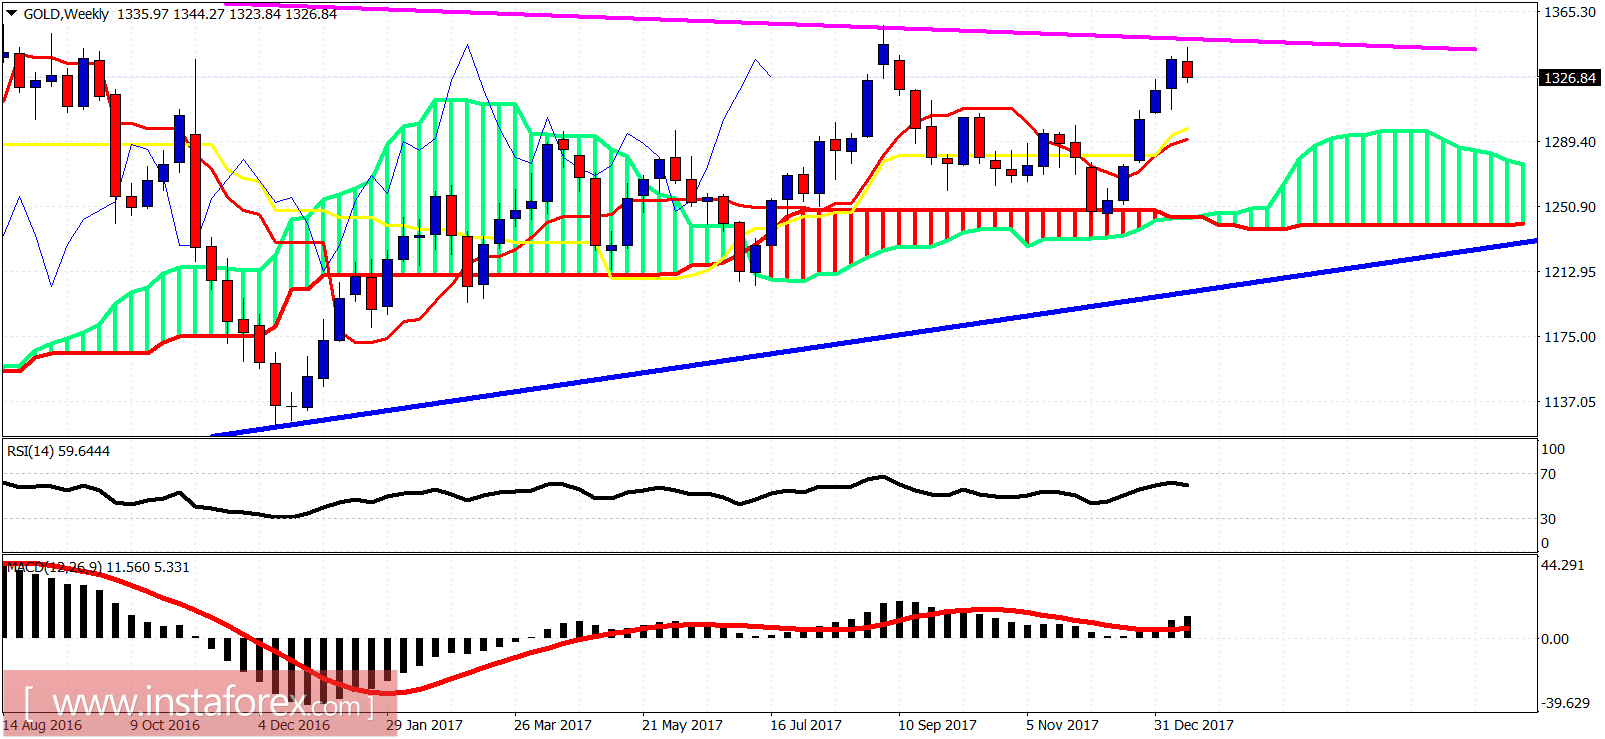
Magenta line - resistance
Blue line - long-term support
We warned that there are many chances of a rejection of the magenta trend line resistance. Gold price could pull back towards the weekly kijun-sen support (yellow line indicator) at $1,297. A weekly close below that level will push price towards the weekly cloud at $1,250.