 English
  Русский
 Bahasa Indonesia
 Bahasa Malay
 ไทย
ไทย Español
 Deutsch
 Български
 Français
 Tiếng Việt
 中文
中文 বাংলা
বাংলা हिन्दी
 Čeština
 Українська
 Română

The Dollar index bounced yesterday, but price remains below the 4-hour kijun-sen. For a bigger bounce to come, we should see a break above yesterday highs. Trend remains bearish but with some reversal warnings.
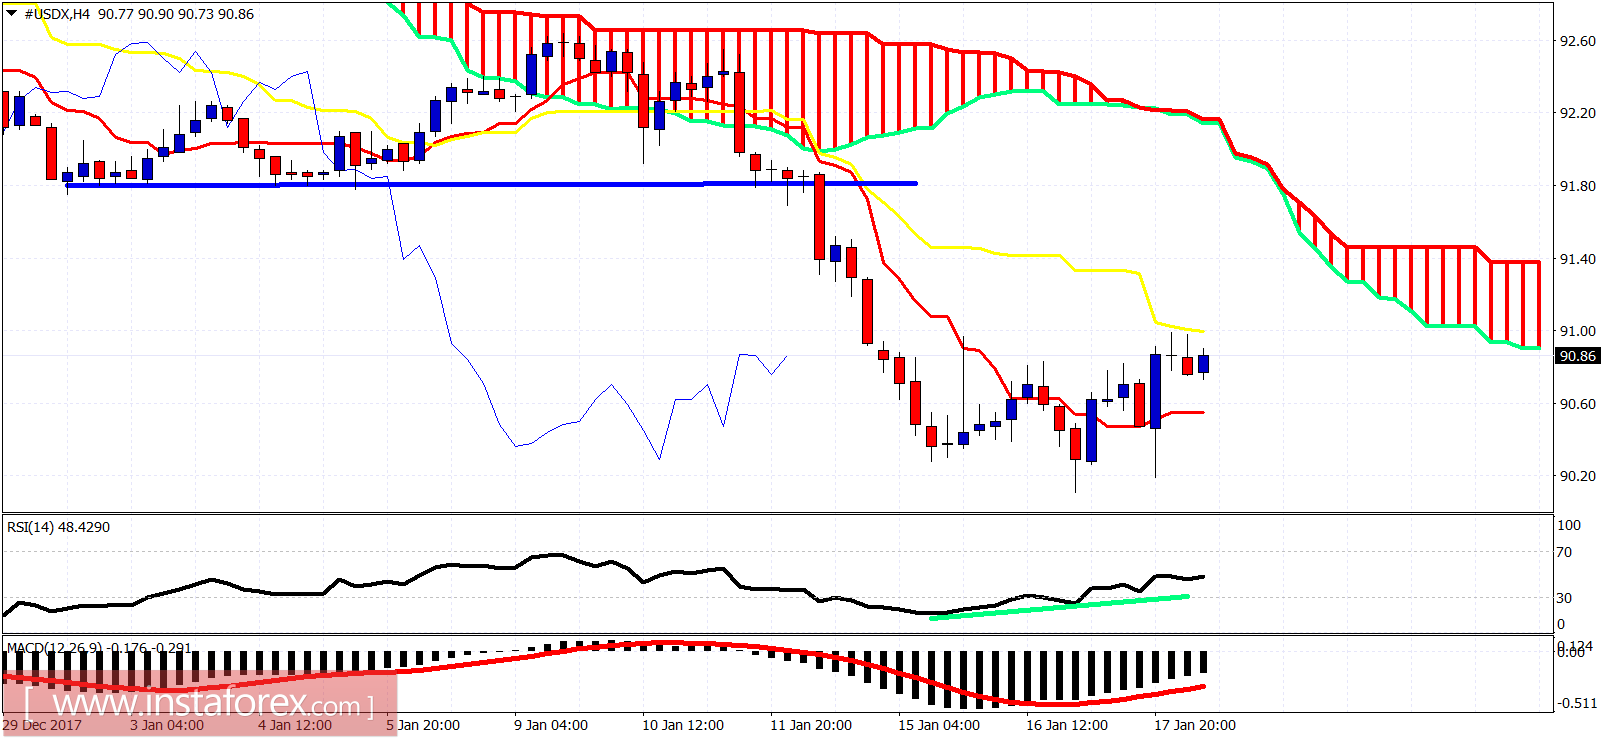
Blue line - resistance
The Dollar index is challenging the kijun-sen. Trend is bearish as price is below the 4-hour Ichimoku cloud. Support is at 90.19 and resistance at 91. Breaking above the resistance will push price towards 91.80. Breaking below support will push price towards 89.50.
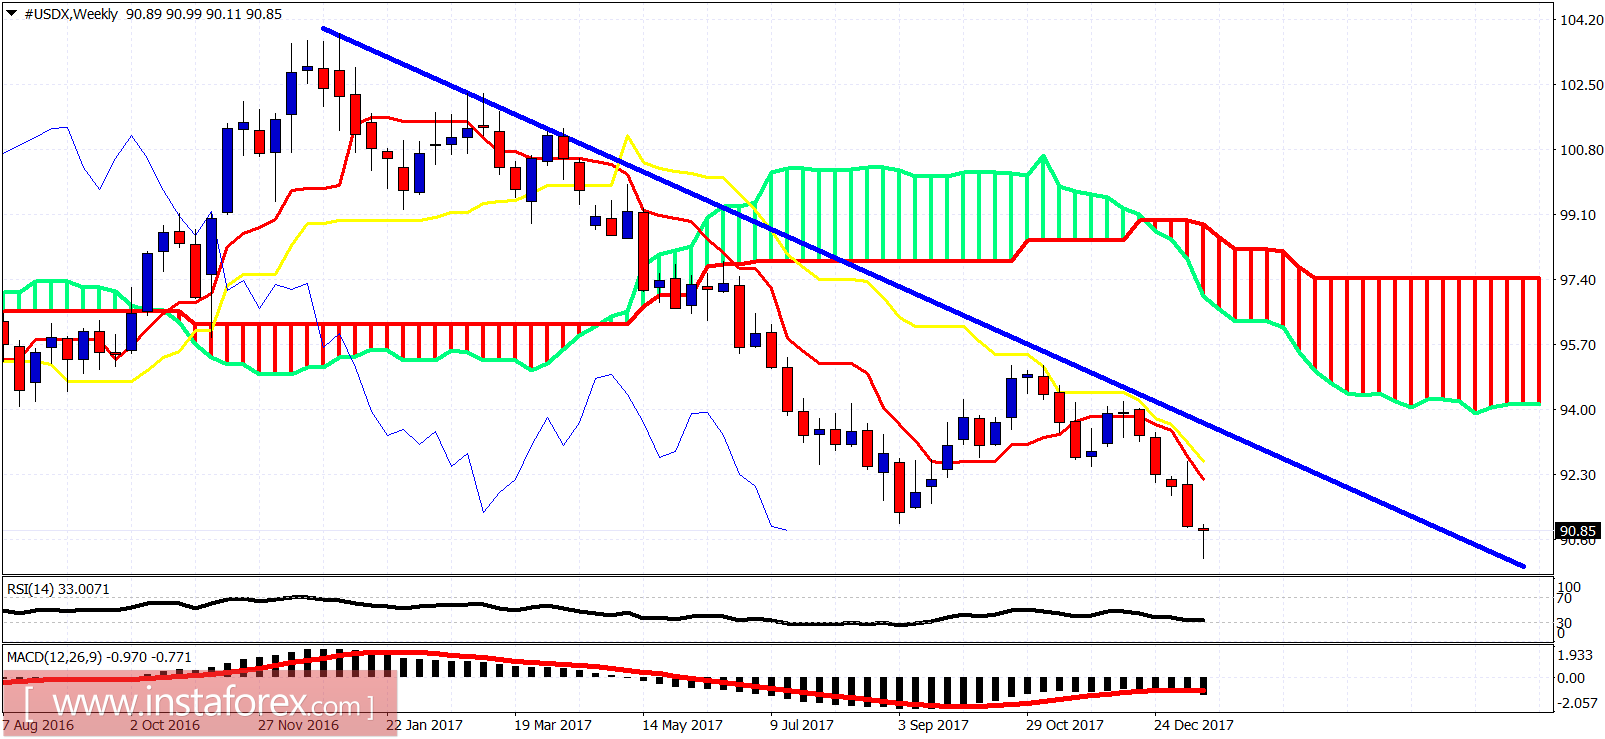
The Dollar index is in a weekly bearish trend. The weekly candle so far is shaping up to be a bullish reversal hammer. We have to more trading sessions including today so traders need to be patient and see where the week closes. A weekly close above 90.80 would be a bullish sign. A weekly close near or below 90.30 will be a bearish sign.