 English
  Русский
 Bahasa Indonesia
 Bahasa Malay
 ไทย
ไทย Español
 Deutsch
 Български
 Français
 Tiếng Việt
 中文
中文 বাংলা
বাংলা हिन्दी
 Čeština
 Українська
 Română

The pair is strengthening the bullish bias across the board with a consolidation ongoing above the 200 SMA at the H1 chart. The support zone of 1.3846 should hold in order to allow further gains toward the 1.3979 level. To the downside, we're expecting a dynamic support around the moving average mentioned above. MACD indicator remains in the negative territory, favoring to the bears in the short-term.
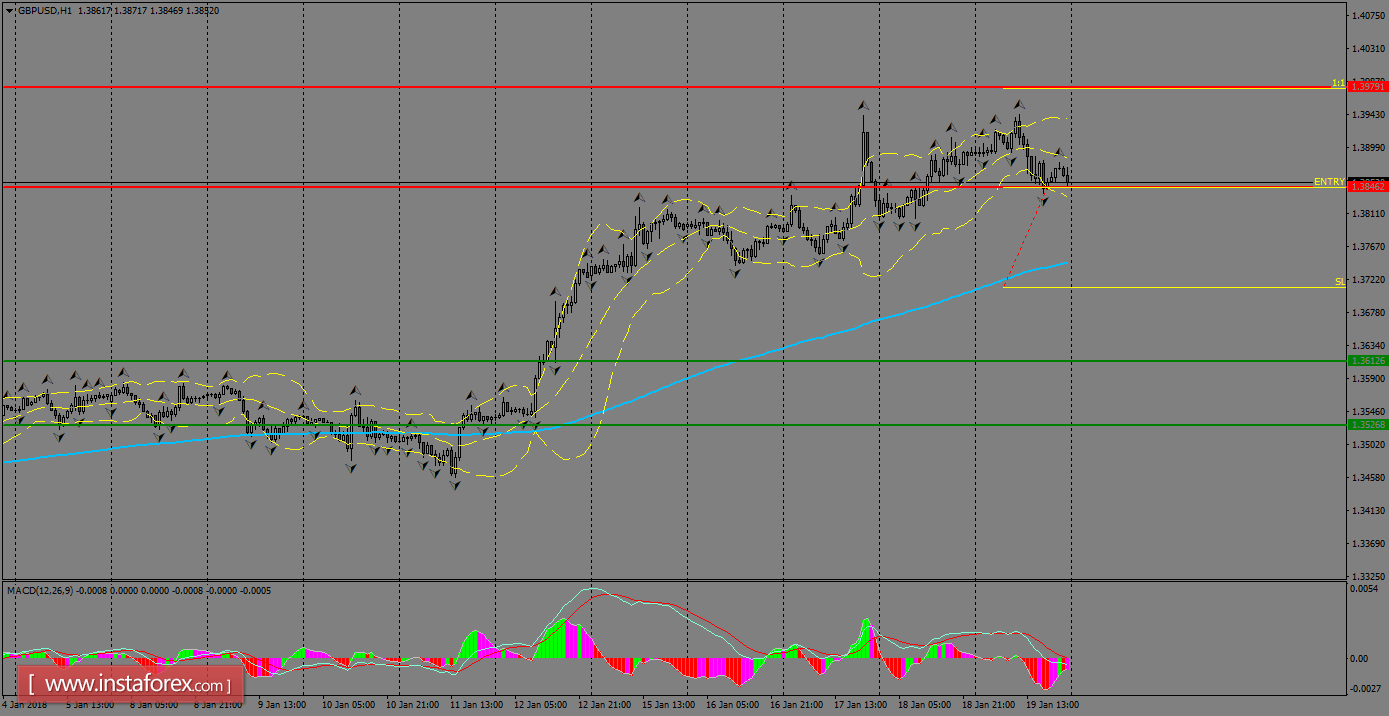
H1 chart's resistance levels: 1.3846 / 1.3979
H1 chart's support levels: 1.3612 / 1.3526
Trading recommendations for today: Based on the H1 chart, buy (long) orders only if the GBP/USD pair breaks a bullish candlestick; the resistance level is at 1.3846, take profit is at 1.3979 and stop loss is at 1.3714.