 English
  Русский
 Bahasa Indonesia
 Bahasa Malay
 ไทย
ไทย Español
 Deutsch
 Български
 Français
 Tiếng Việt
 中文
中文 বাংলা
বাংলা हिन्दी
 Čeština
 Українська
 Română

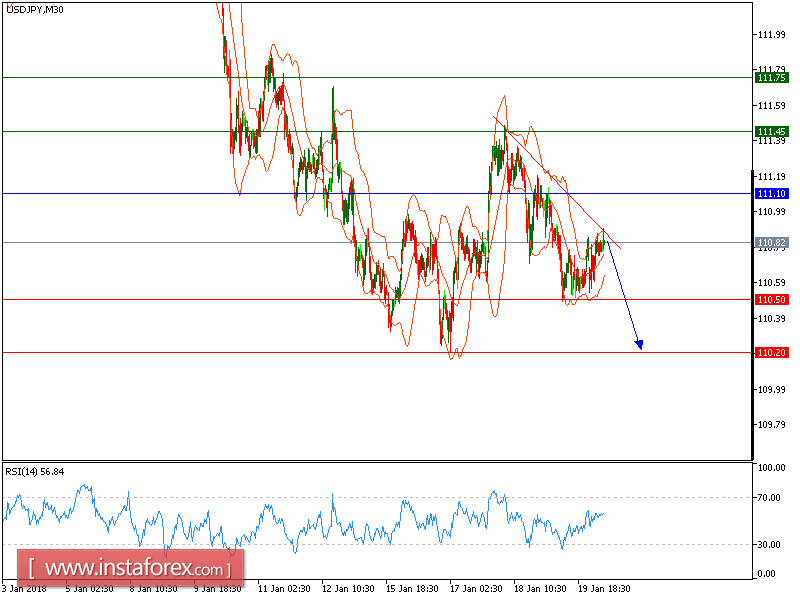
USD/JPY is under pressure. The pair is capped by a declining trend line since January 18, which confirmed a bearish outlook. The descending 50-period moving average is playing a resistance role. The relative strength index is mixed with a bearish bias.
To conclude, below 111.10, look for a new drop with targets at 110.50 and 110.20 in extension.
Alternatively, if the price moves in the opposite direction, a long position is recommended above 111.10 with a target of 111.45.
Chart Explanation: The black line shows the pivot point. The current price above the pivot point indicates a bullish position, while the price below the pivot point is a signal for a short position. The red lines show the support levels and the green line indicates the resistance level. These levels can be used to enter and exit trades.
Strategy: SELL, stop loss at 111.10, take profit at 110.50.
Resistance levels: 111.45, 111.70, and 112.05
Support levels: 110.50, 110.20, and 109.65.