 English
  Русский
 Bahasa Indonesia
 Bahasa Malay
 ไทย
ไทย Español
 Deutsch
 Български
 Français
 Tiếng Việt
 中文
中文 বাংলা
বাংলা हिन्दी
 Čeština
 Українська
 Română

The index is still holding the lows from January 19th and it seems we could expect a rally to test the 200 SMA on H1 chart. The downside continues to be the dominant bias and a moving average could act as a strong dynamic resistance. The nearest support lies at the 89.36 level, where bears could gain traction to continue lower.
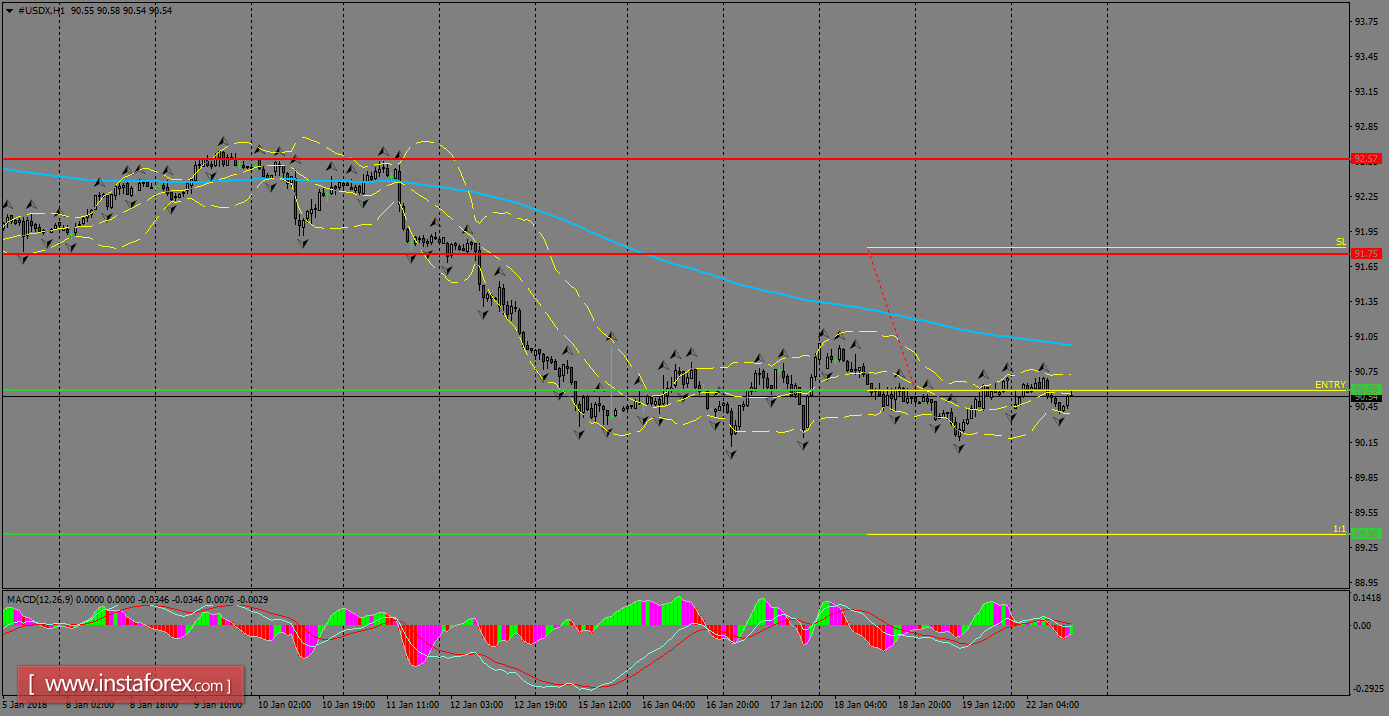
H1 chart's resistance levels: 91.75 / 92.57
H1 chart's support levels: 90.59 / 89.36
Trading recommendations for today: Based on the H1 chart, place sell (short) orders only if the USD Index breaks with a bearish candlestick; the support level is at 90.59, take profit is at 89.36 and stop loss is at 91.81.