 English
  Русский
 Bahasa Indonesia
 Bahasa Malay
 ไทย
ไทย Español
 Deutsch
 Български
 Français
 Tiếng Việt
 中文
中文 বাংলা
বাংলা हिन्दी
 Čeština
 Українська
 Română

The Dollar index has reached our lower targets. Price remains in a bearish trend. The strength of the decline in the Dollar index has broken the bullish divergence signals. The Dollar index is approaching important Fibonacci support levels.
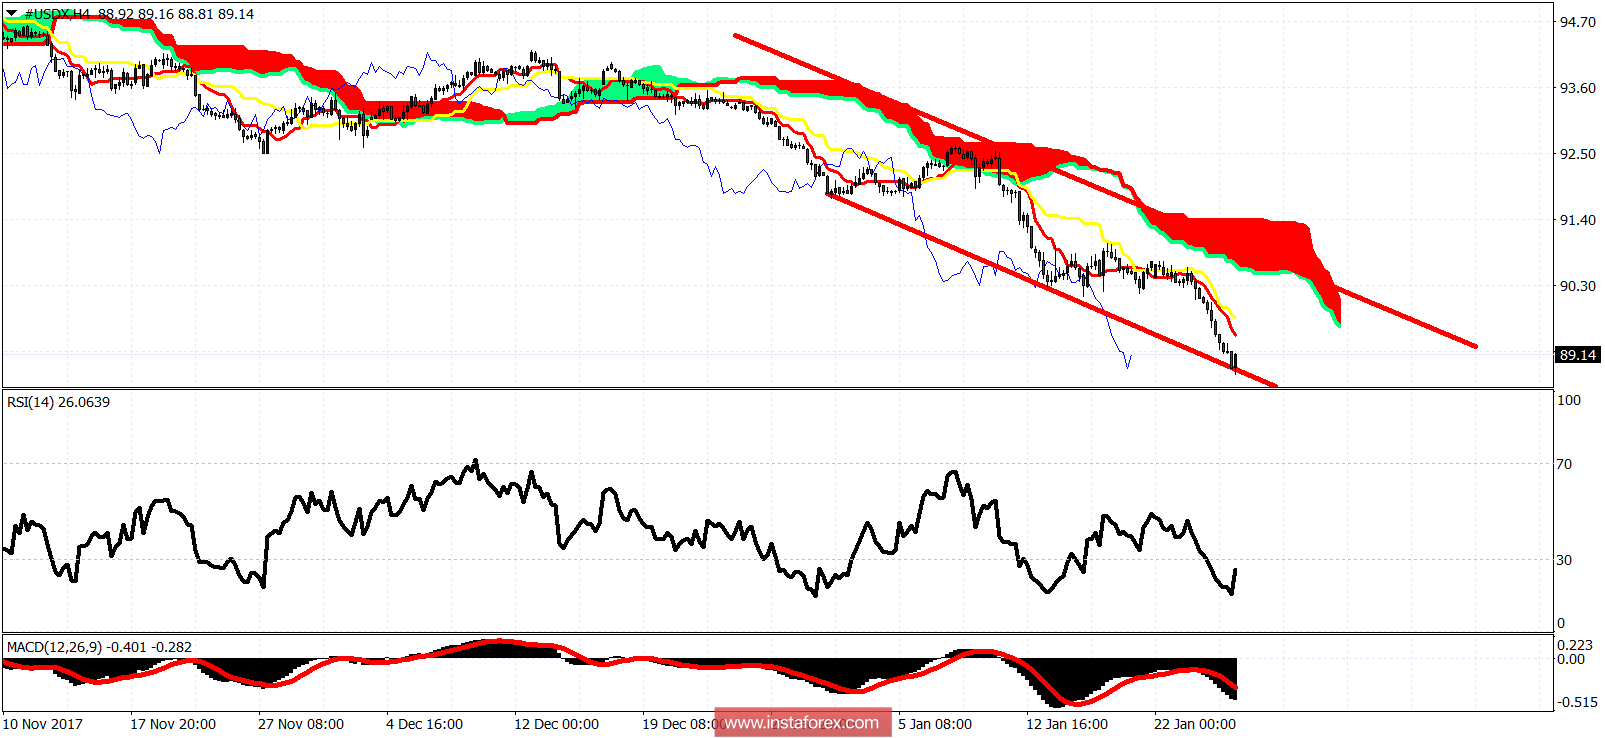
The Dollar index is trading below both the tenkan- and kijun-sen indicators. Resistance is at 89.45-89.77. Support is at 88.80 and next and most important at 88.50.
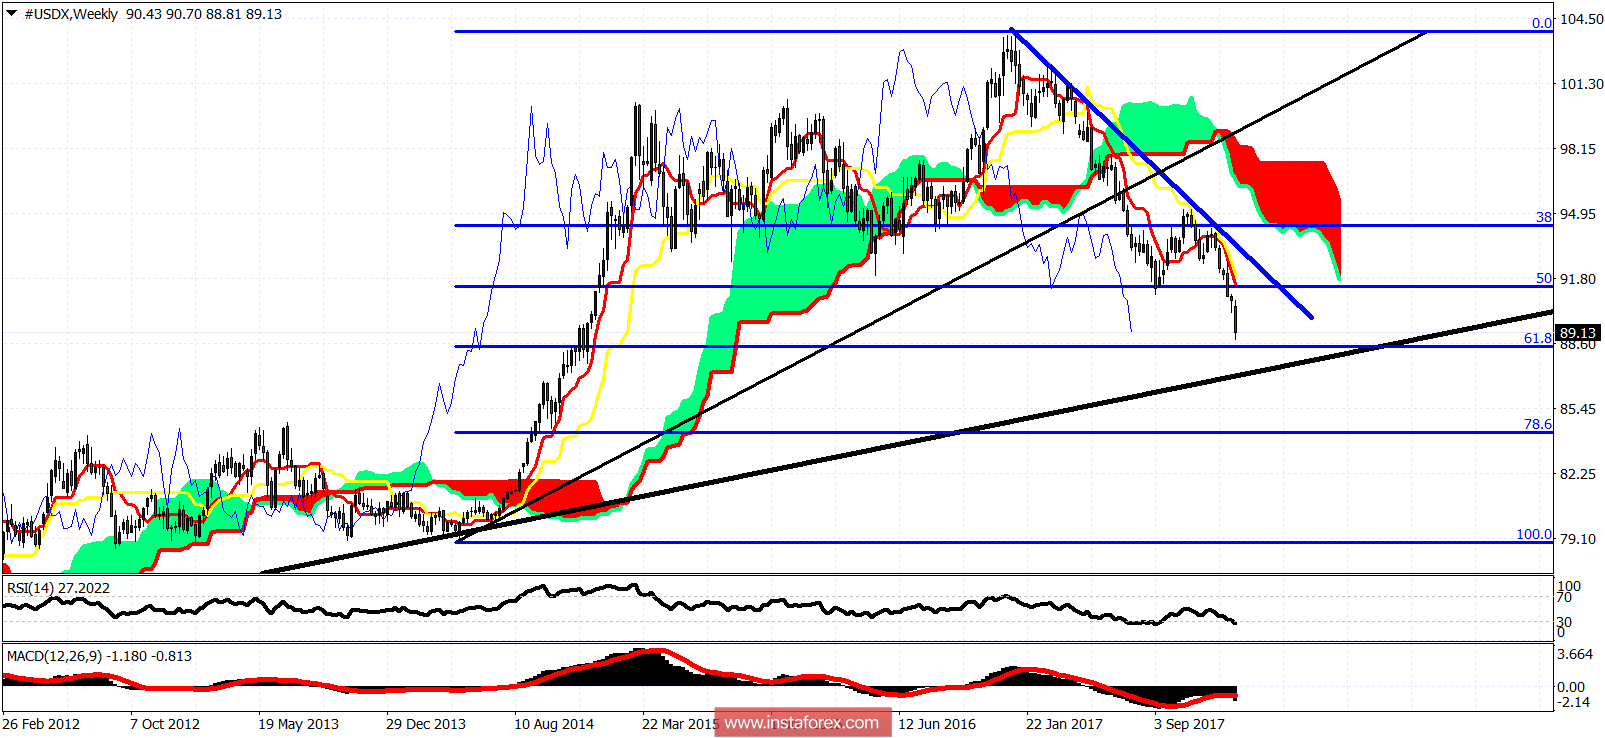
On a weekly basis the Dollar index is in a bearish trend. I believe we are close to the end of the downward move from 103. Important support level is at the 61.8% Fibonacci retracement at 88.50 and at the black trend line support at 87. I expect price to bounce strongly towards 92-94 area once this decline is over around 87-88.