 English
  Русский
 Bahasa Indonesia
 Bahasa Malay
 ไทย
ไทย Español
 Deutsch
 Български
 Français
 Tiếng Việt
 中文
中文 বাংলা
বাংলা हिन्दी
 Čeština
 Українська
 Română

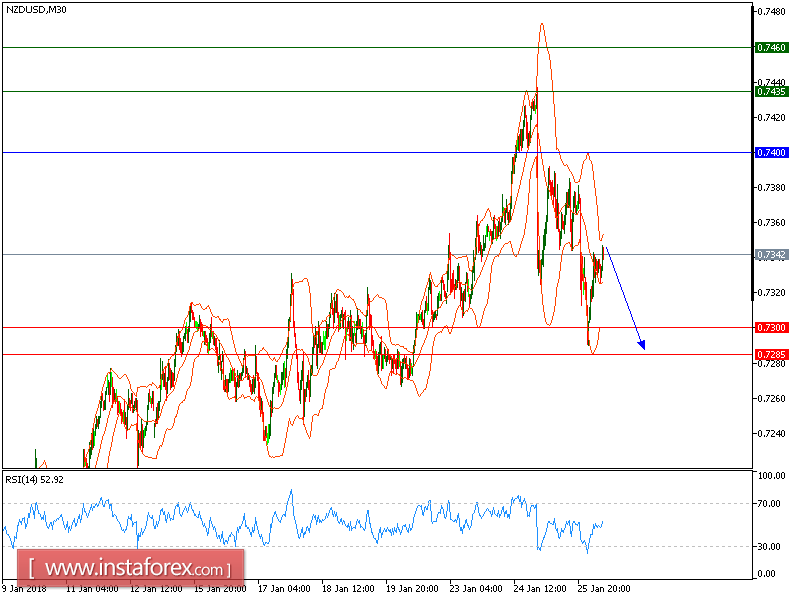
All our downside targets which we predicted in previous analysis have been hit. NZD/USD under pressure. The pair broke below its intraday "symmetrical triangle" pattern, which should confirm a bearish reversal. Both the 20-period and 50-period moving averages are turning down, and should continue to push the prices lower. In addition, the relative strength index is capped by a bearish trend line.
To conclude, as long as 0.7400 is not surpassed, look for further decline to 0.7300 and 0.7285 in extension.
The black line shows the pivot point. Currently, the price is above the pivot point, which is a signal for long positions. If it remains below the pivot point, it will indicate short positions. The red lines are showing the support levels, while the green line is indicating the resistance levels. These levels can be used to enter and exit trades.
Resistance levels: 0.7435, 0.7460, and 0.7485.
Support levels: 0.7300, 0.7285, and 0.7240.